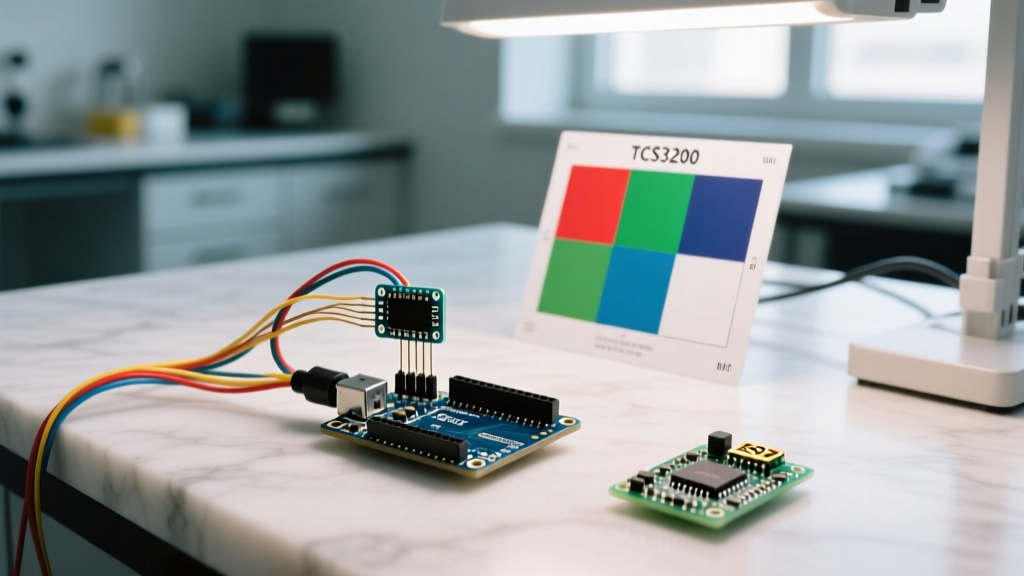

Beyond Raw Data: Engineering a Reliable TCS3200 Color Sensor Arduino Integration
If you have ever wired a TCS3200 color sensor to an Arduino, only to be greeted by erratic, fluctuating RGB values that make no logical sense, you are not alone. The TCS3200 is a remarkably capable chip, but it is fundamentally misunderstood by the DIY community. Unlike standard analog sensors that output a voltage proportional to light intensity, the TCS3200 outputs a square wave frequency. In 2026, generic TCS3200 breakout boards remain a staple in robotics and sorting automation, typically costing between $3.50 and $6.00. However, extracting accurate colorimetry data requires a strict approach to hardware scaling, optical isolation, and mathematical mapping.
This guide bypasses the flawed copy-paste tutorials and provides a senior-level engineering approach to TCS3200 color sensor Arduino integration, focusing on the physics of the photodiode array, precise frequency scaling, and a rigorous white/black calibration protocol.
Architecture: The Photodiode Array and Current-to-Frequency Conversion
At the heart of the breakout board is the TAOS (now ams OSRAM / Texas Instruments) TCS3200D IC. The sensor features an 8x8 array of 64 silicon photodiodes. These are not randomly distributed; they are segmented into four distinct quadrants:
- 16 Red-filtered photodiodes
- 16 Green-filtered photodiodes
- 16 Blue-filtered photodiodes
- 16 Clear (unfiltered) photodiodes for overall luminance
When light strikes the selected photodiode quadrant, the chip's internal current-to-frequency converter generates a square wave. The critical concept to grasp here is that higher light intensity equals higher frequency. For a deep red object, the red-filtered photodiodes will reflect the most light, yielding the highest frequency for the Red channel, while the Blue and Green channels will yield lower frequencies. For a comprehensive understanding of the physics behind color space and filter arrays, refer to the RP Photonics Encyclopedia on Colorimetry.
Pinout and Arduino Wiring Matrix
The TCS3200 communicates via digital logic pins that configure internal multiplexers and oscillators. Below is the definitive wiring matrix for an Arduino Uno, Nano, or any ATmega328P-based board.
| TCS3200 Pin | Function | Arduino Pin | Configuration Notes |
|---|---|---|---|
| VCC | Power (2.7V - 5.5V) | 5V | Do not use 3.3V on standard clone boards; the onboard LEDs require 5V. |
| GND | Ground | GND | Ensure a common ground with your Arduino. |
| S0, S1 | Output Frequency Scaling | 8, 9 | Used to set the base oscillator frequency (2%, 20%, or 100%). |
| S2, S3 | Photodiode Type Selection | 10, 11 | Selects Red, Green, Blue, or Clear filters. |
| OUT | Frequency Output | 12 | Must be connected to a digital pin capable of interrupt or pulseIn(). |
| OE | Output Enable | GND | Active LOW. Tie directly to GND to keep the output constantly enabled. |
The Frequency Illusion: Scaling for Microcontroller Timers
The most common point of failure in TCS3200 color sensor Arduino projects is timer overflow and pulse timeout. The chip can output frequencies up to 600 kHz at 100% scaling. The Arduino pulseIn() function measures the duration of a pulse in microseconds. At 600 kHz, a single pulse cycle lasts roughly 1.6 microseconds. The Arduino's ATmega328P microcontroller, running at 16 MHz, struggles to reliably capture pulses this short using the blocking pulseIn() method, leading to severe jitter and dropped reads.
Step 1: Lock the Scaling to 20%
To guarantee stable readings without resorting to complex hardware interrupts and timer registers, you must configure the S0 and S1 pins to scale the output frequency down to 20%. This caps the maximum frequency at roughly 120 kHz (a pulse width of ~8.3 microseconds), which is perfectly within the reliable capture range of pulseIn().
In your setup() function, hardcode these pins:
digitalWrite(S0, HIGH);
digitalWrite(S1, LOW);
The Calibration Bottleneck: Mapping Frequency to RGB Space
Raw frequency values are entirely relative and useless for cross-environment color matching. If you point the sensor at a red apple, you might get raw values like R: 3500, G: 8000, B: 9200. Notice that the Red value is the lowest number. Because the sensor outputs frequency based on light absorption/reflection, a highly reflective red surface bounces red light back into the red filter, causing a higher frequency. Wait, if red is highly reflective, why is the number lower? Because raw pulseIn() returns time in microseconds, not frequency. Time is the inverse of frequency. Therefore, a highly reflective color yields a high frequency, which means a shorter pulse duration (lower microsecond value).
To convert these inverted microsecond readings into a standard 0-255 RGB color space, you must perform a two-point calibration using a pure white reference and a pure black reference. You can read more about standard sensor calibration matrices in Texas Instruments' Optical Sensor Application Notes.
Step 2: The White and Black Reference Protocol
- Capture White Bounds: Place a matte white PTFE or coated paper card exactly 12mm from the sensor (the optimal focal distance for the onboard LEDs). Record the microsecond values for R, G, and B. These will be your minimum time values (highest reflection).
- Capture Black Bounds: Replace the white card with a matte black anodized surface or black electrical tape. Record the R, G, and B values. These will be your maximum time values (lowest reflection).
- Apply the Map Function: Use the Arduino
map()function to invert and scale the data.
int redVal = map(rawRed, whiteRed, blackRed, 255, 0);
Expert Warning: Never use glossy photo paper or standard printer paper for your white calibration. Standard printer paper contains optical brightening agents (OBAs) that fluoresce under the UV spectrum of the TCS3200's white LEDs, artificially inflating the blue channel and ruining your baseline. Use a matte, uncoated white cardstock or a dedicated 18% gray/white photography target.
Real-World Failure Modes and Troubleshooting Matrix
Even with perfect code, optical physics will sabotage your project if you ignore the physical environment. Below is a diagnostic matrix for the most common edge cases encountered in industrial and hobbyist sorting machines.
| Failure Symptom | Root Cause | Engineering Solution |
|---|---|---|
| Sensor reads "White" on dark, shiny objects (e.g., black acrylic, metallic foil). | Specular reflection. The 4 onboard white LEDs reflect directly off the glossy surface into the lens, bypassing the pigment absorption. | Remove the onboard LEDs (desolder or cover). Use an external, off-axis ring light. Alternatively, place a linear polarizing film over the sensor lens and a cross-polarized film over the light source. |
| Readings fluctuate wildly at exactly 100Hz or 120Hz intervals. | Ambient AC lighting flicker. Fluorescent or cheap LED room lights flicker at twice the mains frequency (50Hz/60Hz). | Shroud the sensor in an opaque 3D-printed PLA/PETG tube. The TCS3200 must operate in a controlled, isolated optical chamber. |
| RGB values drift slowly over 30 minutes of operation. | Thermal drift of the onboard oscillator and LED color temperature shift as the breakout board heats up. | Implement a software auto-white-balance routine that reads a known white reference on the conveyor belt every 60 seconds to dynamically update the map() bounds. |
| Readings are stable but completely inaccurate (e.g., Orange reads as Yellow). | Incorrect focal distance. The photodiode array requires a specific focal plane to resolve color accurately without cross-talk from adjacent pixels. | Machine a physical spacer to lock the sensor exactly 12mm to 15mm from the target surface. Do not rely on manual hand-holding. |
Advanced Integration: PWM Dimming for High-Gain Targets
In 2026, advanced sorting applications often deal with highly reflective or translucent materials (like sorting different types of PET plastics). The default 5V drive to the four onboard white LEDs is often too harsh, causing sensor saturation where all channels max out at 255. By routing the LED power pin through a MOSFET controlled by an Arduino PWM pin, you can dynamically adjust the illumination intensity. Lowering the LED brightness increases the dynamic range of the sensor when scanning highly reflective metallic or glossy targets, allowing the photodiode array to capture subtle pigment variations that would otherwise be washed out by overexposure.
Summary
Successfully integrating the TCS3200 color sensor with an Arduino requires moving beyond simple voltage-reading mental models. By treating the sensor as a frequency-generating optical instrument, locking the S0/S1 scaling to 20% to prevent timer overflow, executing a rigorous matte-surface white/black calibration, and physically isolating the optical path from ambient AC flicker, you can transform a $4 breakout board into a highly reliable colorimetry engine.