
Understanding Photoplethysmography (PPG) Sensor Architectures
When integrating a pulse sensor with Arduino for biomedical prototyping, interactive art, or fitness telemetry, you are fundamentally working with Photoplethysmography (PPG). PPG measures the volumetric variations of blood circulation by shining light into the skin and measuring the scattered or reflected photons. As the heart pumps, capillary blood volume increases, absorbing more light and reducing the amount that reaches the photodetector.
In 2026, the maker and engineering communities primarily rely on two distinct hardware architectures for this task. Selecting the right sensor dictates your wiring topology, code complexity, and ultimate signal fidelity.
Hardware Comparison Matrix
| Feature | PulseSensor Amped (Analog) | MAX30102 Breakout (I2C) |
|---|---|---|
| Price Range | $24.99 (Official) / $6.00 (Clone) | $14.95 (SparkFun) / $4.50 (Clone) |
| Light Source | Green LED (530nm) | Red (660nm) & IR (880nm) |
| Interface | Analog Voltage (0-5V or 0-3.3V) | I2C (SCL, SDA) |
| Best Use Case | Simple BPM tracking, education | SpO2 calculation, high-fidelity HRV |
| Code Complexity | Low (ADC polling or interrupts) | High (FIFO buffer management) |
For most standard heart-rate monitoring projects, the analog PulseSensor Amped remains the gold standard due to its simplicity. However, if your project requires calculating blood oxygen saturation (SpO2) or analyzing Heart Rate Variability (HRV) with clinical precision, the MAX30102 is mandatory. You can review the SparkFun MAX30105 Hookup Guide for advanced I2C implementations.
Hardware Wiring: Pinouts and Power Integrity
Wiring a standard analog pulse sensor with Arduino requires more attention to power integrity than most beginners realize. The sensor outputs a tiny analog signal (often fluctuating by only 20-50mV around a 1.5V DC bias). Any noise on the power rail will directly couple into your signal.
Standard Pinout (Arduino Uno/Nano/Mega)
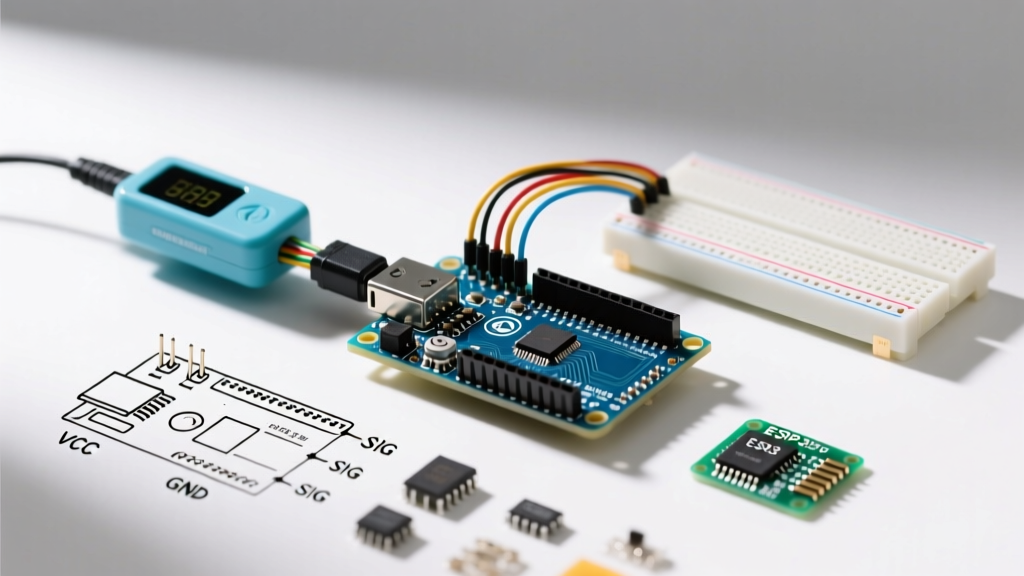
- VCC (Red Wire): Connect to 5V. (If using a 3.3V MCU like the ESP32 or Arduino Due, connect to 3.3V. The sensor's internal op-amp will rail if overvolted).
- GND (Black Wire): Connect to the MCU's GND.
- Signal (Purple/White Wire): Connect to Analog Pin A0.
The 0.1µF Decoupling Capacitor Rule
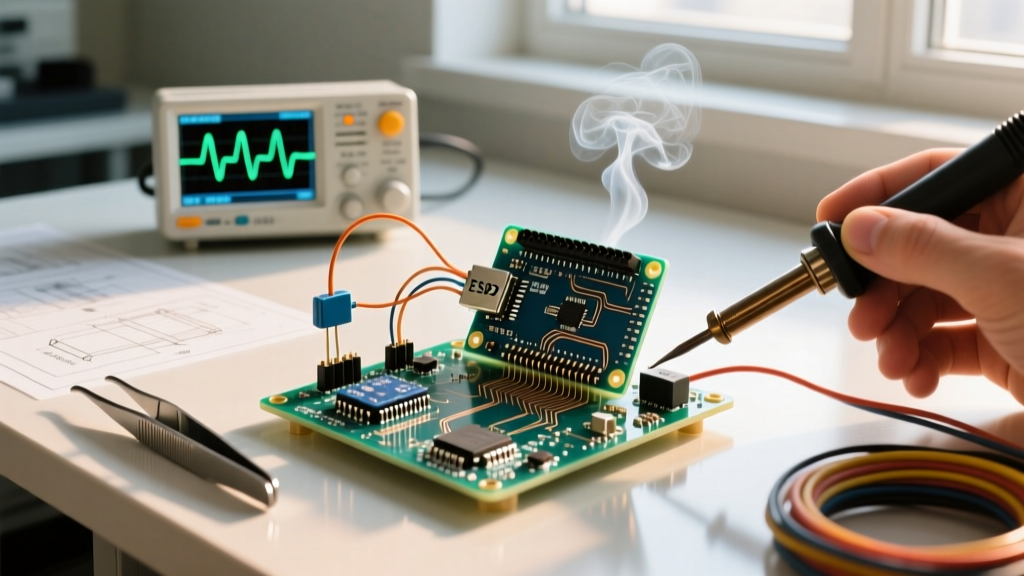
USB power supplies and switching regulators introduce high-frequency ripple. Because the PPG signal resides in the 0.5Hz to 5Hz range, high-frequency noise can alias or saturate the Arduino's internal operational amplifiers. Solder a 0.1µF ceramic capacitor directly across the VCC and GND pads on the back of the sensor PCB. This localized energy reservoir filters out switching noise before it reaches the phototransistor.
Writing Robust Arduino Code: Polling vs. Hardware Interrupts
The most common failure mode when programming a pulse sensor with Arduino is the use of delay() or blocking serial prints inside the main loop. The human heart beats between 40 and 180 BPM (roughly 0.75 to 3 Hz). To accurately capture the waveform's systolic peak without aliasing, you must sample at a minimum of 100Hz, though 500Hz is ideal.
Expert Rule of Thumb: Never use delay() in a PPG sketch. A single 10ms delay inside a loop limits your maximum sampling rate to 100Hz, and any serial communication overhead will cause severe timing jitter, destroying your Inter-Beat Interval (IBI) calculations.
Implementing Hardware Interrupts
To achieve a rock-solid 500Hz sampling rate, utilize the Arduino's hardware timers. The PulseSensorPlayground library handles this elegantly. According to the official Arduino Interrupt Reference, tying the sampling routine to a hardware timer ensures the Analog-to-Digital Converter (ADC) is read at exact microsecond intervals, regardless of what the main loop is doing.
Below is the structural logic for an interrupt-driven BPM calculation:
- Initialize Timer: Configure Timer1 or Timer2 to trigger an Interrupt Service Routine (ISR) every 2ms (500Hz).
- Read ADC in ISR: Inside the ISR, read
analogRead(A0)and store the value in a volatile variable. - Peak Detection: In the main loop, analyze the buffered data. Look for a signal that crosses a dynamic threshold (usually 50% of the running average amplitude).
- Calculate IBI: Record the
micros()timestamp when a peak is confirmed. Subtract the previous peak's timestamp to find the Inter-Beat Interval (IBI) in microseconds. - Compute BPM: Use the formula:
BPM = 60000000 / IBI_microseconds.
Signal Processing: Defeating Motion Artifacts and Vasoconstriction
Raw PPG data is notoriously noisy. If you simply wire a pulse sensor with Arduino and print the raw ADC values to the serial plotter, you will immediately see baseline wander and high-frequency spikes. Understanding the physical failure modes is critical for writing effective software filters.
1. Motion Artifacts (The Baseline Wander)
When the user moves their finger, the physical distance between the LED, the skin, and the photodetector changes. This causes massive low-frequency swings in the DC bias of the signal. Solution: Implement a software Bandpass Filter. A 2nd-order Butterworth filter with a passband of 0.5Hz to 3.5Hz will allow human heart rates (30 to 210 BPM) to pass while rejecting DC drift and 50/60Hz mains hum.
2. Vasoconstriction (Cold Fingers)
In cold environments, the body restricts blood flow to the extremities to preserve core temperature. The AC component of the PPG signal (the actual pulse) can drop below the noise floor of the Arduino's 10-bit ADC (which has a resolution of roughly 4.8mV per step at 5V). Solution: If the peak-to-peak amplitude drops below 10 ADC units, trigger a 'Poor Signal' warning in your code rather than outputting false BPM data. Alternatively, move the sensor from the fingertip to the earlobe, which is less prone to vasoconstriction.
3. Ambient Light Ingress
Fluorescent lights and sunlight contain 100Hz/120Hz flicker that can bleed into the phototransistor. Solution: Always use an opaque silicone shroud or a piece of heat-shrink tubing to shield the sides of the sensor. In software, apply a 4-point moving average filter to smooth out high-frequency optical noise before running the peak-detection algorithm.
Diagnostic Troubleshooting Matrix
When your serial monitor outputs erratic data or flatlines, use this matrix to isolate the fault.
| Symptom | Probable Cause | Engineering Fix |
|---|---|---|
| Signal is pegged at 1023 or 0 | Op-amp saturation or incorrect voltage reference | Verify VCC is exactly 5V or 3.3V. Check for short circuits on the signal trace. |
| BPM reads exactly double the actual heart rate | Dicrotic notch triggering as a second peak | Increase the software refractory period. Ignore any secondary peaks that occur within 250ms of a primary systolic peak. |
| Massive 50Hz/60Hz sine wave overlay | Mains hum coupling into the analog trace | Use shielded cable for the sensor leads. Ensure the MCU and sensor share a common, star-grounded GND plane. |
| Signal flatlines when finger is pressed hard | Capillary blanching (ischemia) | Reduce physical pressure. The sensor requires light contact; pressing too hard squeezes the blood out of the capillary bed. |
Final Calibration and Deployment
Before deploying your pulse sensor with Arduino into a final enclosure, perform a 5-minute continuous logging test against a commercial medical pulse oximeter. Calculate the Pearson correlation coefficient between your Arduino's IBI timestamps and the reference device. A well-tuned analog PPG circuit with proper interrupt-driven sampling and software bandpass filtering should achieve a correlation of >0.95, proving your hardware and code are ready for real-world biometric tracking.