The Real-World Challenge of Photoplethysmography (PPG)
In 2026, biometric tracking has moved beyond simple fitness watches into high-stakes environments like e-sports cognitive training, industrial operator fatigue monitoring, and clinical biofeedback therapy. While commercial wearables rely on proprietary, black-box AI algorithms to clean up noisy data, building a custom pulse sensor Arduino rig gives engineers and researchers raw, unfiltered access to the photoplethysmography (PPG) waveform. This level of access is critical when you need to calculate Heart Rate Variability (HRV) or detect micro-stress responses that commercial devices intentionally smooth over.
However, reading a pulse is trivial in a simulation; capturing a clean arterial waveform in a room full of 60Hz mains interference, USB power ripple, and motion artifacts is a rigorous exercise in embedded systems engineering. This guide details the exact hardware selection, signal conditioning, and interrupt-driven firmware required to build a reliable, real-world biofeedback monitor.
Hardware Showdown: Pulse Sensor Amped vs. MAX30102
When designing a PPG front-end for an Arduino, you generally choose between the classic analog teardrop sensor and modern digital I2C modules. Below is a technical comparison to help you select the right component for your specific application.
| Feature | Pulse Sensor Amped (SEN-11574) | MAX30102 Module (Generic Clone) |
|---|---|---|
| Approx. Cost (2026) | $18.95 (Authentic) | $4.50 - $6.00 |
| Interface | Analog Voltage (0-5V) | I2C (Digital) |
| LED Wavelength | 525nm (Green) | 660nm (Red) & 880nm (IR) |
| Onboard DSP | Hardware Op-Amp (Analog Filter) | None (Raw ADC data via I2C) |
| Best Use Case | Prototyping, analog signal analysis, educational biofeedback | SpO2 calculations, wearable integration, low-power sleep modes |
For a desktop biofeedback monitor where the user's finger rests in a stationary clip, the Pulse Sensor Amped remains the gold standard. Its onboard analog filtering removes high-frequency noise before the signal even reaches the Arduino's ADC, saving significant DSP overhead in your firmware. According to the official Pulse Sensor documentation, the analog output is biased at V/2, meaning it rests at 2.5V (on a 5V system) and oscillates by roughly 50mV to 100mV with each heartbeat.
Schematic and Signal Conditioning
The most common point of failure in DIY pulse sensor Arduino projects is ignoring power rail noise. The Arduino Uno or Nano's onboard 5V linear regulator is notoriously susceptible to USB ripple, which injects a 120Hz hum (from full-wave rectified 60Hz AC) directly into your analog readings.
The Hardware Low-Pass Fix
To achieve clinical-grade signal fidelity, implement the following hardware modifications:
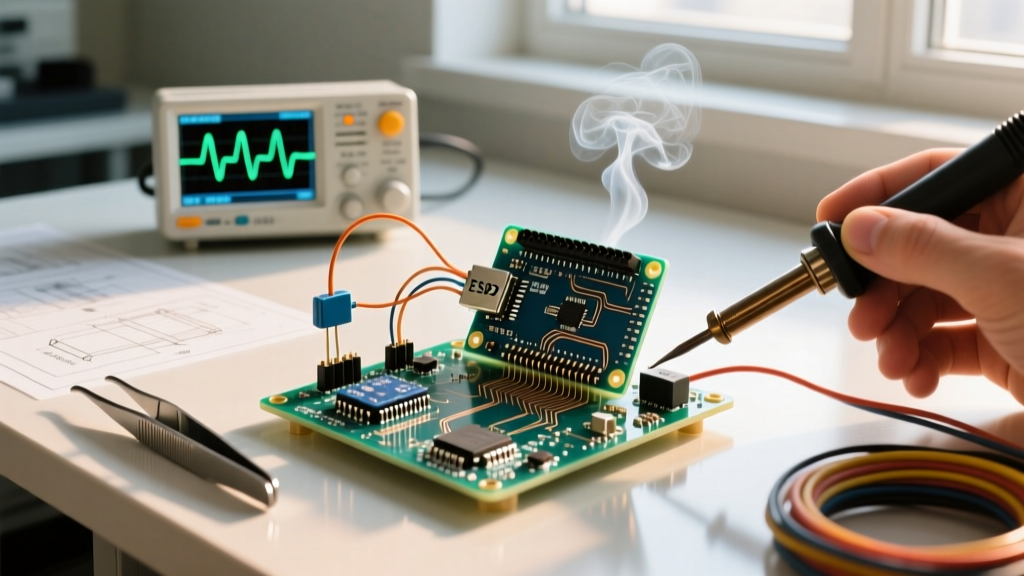
- Decoupling Capacitor: Solder a 10µF electrolytic capacitor and a 100nF ceramic capacitor in parallel across the VCC and GND pins directly at the sensor header. This creates a local energy reservoir and shunts high-frequency switching noise to ground.
- Shielded Cabling: Use a 3-core shielded microphone cable for the connection between the sensor and the Arduino. Tie the shield to the Arduino's GND pin only (to prevent ground loops).
- ADC Reference: If using a 3.3V Arduino board (like the Nano 33 IoT), ensure you set the analog reference using
analogReference(AR_DEFAULT)to maximize the 10-bit or 12-bit ADC resolution across the sensor's output swing.
Firmware Architecture: Ditching delay() for Hardware Interrupts
A fundamental rule of real-time biosignal acquisition is that your sampling rate must remain perfectly constant. If you use delay() or perform blocking operations (like writing to an LCD or sending Serial data) inside your main loop, your sampling interval will jitter. A jittery sampling interval completely destroys the phase data required for accurate Heart Rate Variability (HRV) analysis.
According to Arduino's official programming documentation on interrupts, utilizing hardware timers ensures that your Analog-to-Digital conversions occur at exact microsecond intervals, regardless of what the rest of your code is doing.
Implementing TimerOne for 500Hz Sampling
To capture the dicrotic notch (the secondary wave caused by the aortic valve closing), a sampling rate of at least 250Hz is required. We will target 500Hz (one sample every 2000µs) using the TimerOne library.
Expert Insight: Never perform floating-point math or Serial printing inside an Interrupt Service Routine (ISR). The ISR should only read the ADC, store the value in a volatile circular buffer, and set a boolean flag. The main loop handles the heavy DSP and UI updates when the flag is triggered.
The core logic for detecting the Inter-Beat Interval (IBI) relies on dynamic thresholding. Because ambient light and finger pressure change the DC offset of the signal, a static threshold will fail. Instead, implement a moving average of the signal's peak and trough over a 2-second rolling window. Set your trigger threshold at 60% of the amplitude between the rolling peak and trough.
Troubleshooting Real-World Edge Cases
Even with perfect code, PPG sensors are highly susceptible to physiological and environmental variables. Here is how to handle the most common field failures:
1. Vasoconstriction (Cold Fingers)
In cold environments, peripheral blood vessels constrict, drastically reducing the AC amplitude of the PPG signal. The green LED on the Pulse Sensor Amped penetrates only ~1-2mm into the tissue. If the signal amplitude drops below 10 ADC units, your firmware should trigger a 'Poor Signal' warning rather than outputting a false, noisy BPM. Solution: Implement an amplitude-validation gate in your DSP; if Peak-to-Trough < 15, pause BPM calculations.
2. Motion Artifacts
While the FDA notes in their guidance on pulse oximetry and PPG limitations that motion is the primary enemy of optical heart rate sensors, desktop biofeedback rigs can bypass this mechanically. Use a 3D-printed finger clip lined with closed-cell foam to apply consistent, gentle pressure. Too much pressure occludes the capillary bed (flattening the waveform); too little allows ambient light to leak into the photodiode.
3. 50Hz/60Hz Mains Interference
If your raw signal looks like a thick, fuzzy band rather than a clean line, you are picking up electromagnetic interference from nearby fluorescent lights or ungrounded laptop chargers. Solution: Apply a digital Infinite Impulse Response (IIR) notch filter in your main loop, specifically tuned to 50Hz or 60Hz depending on your local power grid, or physically move the rig away from AC-DC switching power supplies.
Validating Your BPM Output
Before deploying your pulse sensor Arduino monitor for actual biofeedback sessions, you must validate its accuracy against a clinical baseline. 1. Connect your Arduino's serial output to a logging script (Python via PySerial works perfectly). 2. Simultaneously wear a validated medical-grade chest strap (like a Polar H10) or a clinical fingertip pulse oximeter. 3. Record 5 minutes of resting heart rate data. 4. Calculate the Mean Absolute Error (MAE). A well-tuned analog PPG setup with a 500Hz sampling rate and dynamic thresholding should yield an MAE of less than ±2 BPM compared to an ECG chest strap under resting conditions.
Building a robust biometric interface goes far beyond copying a tutorial sketch. By mastering hardware signal conditioning, interrupt-driven sampling, and dynamic DSP thresholding, you transform a basic hobbyist component into a reliable, real-world biofeedback instrument capable of powering advanced 2026 cognitive and physiological research.