Building a custom digital dashboard is one of the most rewarding automotive DIY projects, but raw data straight from the vehicle's CAN bus or a GPS module is rarely ready for prime time. When you first wire up an Arduino car display, you will likely notice speedometer lag, erratic fuel level readings, and temperature offsets. These discrepancies are not necessarily hardware failures; they are calibration issues. Factory sensors prioritize cost-effectiveness over pinpoint accuracy, and OBD2 polling introduces inherent latency.
This guide dives deep into the calibration and accuracy tuning required to transform a basic microcontroller setup into a reliable, race-grade digital dash. We will cover OBD2 PID scaling, GPS data fusion, non-linear fuel tank mapping, and power rail stabilization.
The Hardware Baseline for Accurate Acquisition
Before writing calibration algorithms, your hardware must be capable of high-speed, lossless data acquisition. Many builders fail at the calibration stage because their underlying data stream is corrupted.
- Microcontroller: Skip the Arduino Uno. Use a Teensy 4.1 (approx. $32) or an Arduino Mega 2560 ($28). The Teensy's 600 MHz clock and hardware serial ports prevent buffer overflows when parsing NMEA GPS sentences simultaneously with high-baud-rate OBD2 CAN traffic.
- OBD2 Interface: Avoid cheap, unbranded ELM327 Bluetooth clones. They frequently drop CAN frames at high RPMs. Use a genuine ELM327 v1.5 wired UART module or, ideally, an STN1110 OBD-II to UART interpreter ($45), which supports advanced multiplexing and faster AT command execution. For deeper protocol documentation, refer to the official ELM327 datasheet.
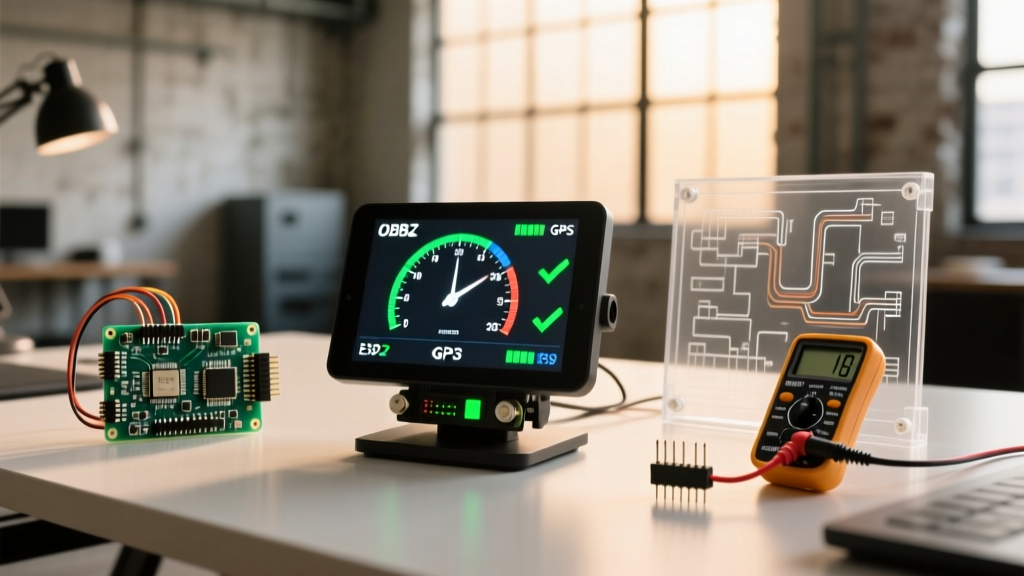
- Display Module: The Nextion NX8048P070 (7-inch HMI, approx. $85) is the industry standard for custom dashes. It offloads UI rendering from the Arduino via a simple serial protocol, freeing up MCU cycles for sensor calibration math.
OBD2 Speed Calibration and Tire Size Correction
The Vehicle Speed Sensor (VSS) data retrieved via OBD2 PID 0x0D is calculated by the ECU based on the factory tire circumference. If you have installed aftermarket wheels or tires, your Arduino car display will show the wrong speed.
Calculating the Correction Factor
To calibrate the speedometer, you must calculate the percentage difference between the stock and new tire diameters. You can find exact diameters using the Tire and Rim Association standards or online calculators.
The formula for the corrected speed is:
V_display = V_obd2 * (D_new / D_stock)
For example, if your stock tire diameter is 25.3 inches and you upgrade to 26.8 inches, your correction factor is 1.059. If the OBD2 PID reports 60 MPH, your display should render 63.5 MPH. Implement this as a floating-point multiplier in your Arduino sketch before sending the integer value to the Nextion display.
Polling Rate Optimization
According to the standard OBD-II PID documentation, requesting PIDs too rapidly can flood the CAN bus and trigger ECU fault codes. Set your serial polling interval to 50ms for critical data (RPM, Speed) and 200ms for slow-changing data (Coolant Temp, Fuel Level). This balance minimizes display latency without overwhelming the vehicle's network.
GPS vs. VSS Data Fusion for Pinpoint Accuracy
While OBD2 provides instant throttle response, GPS provides true ground speed unaffected by tire wear, pressure, or load. However, GPS suffers from latency (typically 200ms to 1 second) and urban multipath errors. The most accurate Arduino car displays fuse both data streams.
Expert Tip: Never rely solely on theGPRMCNMEA sentence for speed. Parse theGPVTG(Track Made Good and Ground Speed) sentence, which provides speed in knots and km/h directly, reducing floating-point math overhead on the microcontroller. For comprehensive NMEA parsing strategies, the Adafruit Ultimate GPS guide offers excellent baseline libraries.
Implementing a Complementary Filter
Instead of a complex Kalman filter, a complementary filter is often sufficient for automotive dashboards. It trusts the OBD2 VSS data for rapid acceleration/deceleration and uses GPS to correct long-term drift.
Fused_Speed = (Alpha * V_obd2) + ((1 - Alpha) * V_gps)
Set Alpha to 0.85. This means the display reacts 85% to the instant OBD2 data, but continuously pulls the baseline 15% from the GPS to ensure that when you are cruising on the highway, your displayed speed perfectly matches a radar gun.
Non-Linear Fuel Tank Mapping
Fuel level sensors are essentially variable resistors attached to a float arm. Because fuel tanks are rarely perfect rectangles (they are molded to fit around exhausts and axles), a 50% drop in the float arm's angle does not equal a 50% drop in fuel volume. If you map OBD2 PID 0x2F (Fuel Tank Level Input) linearly, your display will show 'Half Empty' when the tank is actually 65% full.
Creating a Piecewise Calibration Matrix
To fix this, you must map the physical tank geometry using a piecewise linear interpolation table. Fill your tank to the brim, reset your trip meter, and drive exactly 2 gallons worth of distance. Record the OBD2 PID value at each interval.
| Actual Volume (Gal) | OBD2 PID Raw Value (0-255) | Calibrated Display % | Correction Delta |
|---|---|---|---|
| 14.0 (Full) | 255 | 100% | 0% |
| 12.0 | 210 | 85% | +3% |
| 10.0 | 165 | 71% | +12% |
| 7.0 (Half) | 95 | 50% | +18% |
| 3.0 | 35 | 21% | -5% |
| 0.0 (Empty) | 0 | 0% | 0% |
Store these mapped values in an array in your Arduino code and use the map() function between the known breakpoints to render a perfectly accurate fuel gauge on your Nextion screen.
Thermal and Voltage Drift Mitigation
Accuracy is not just about software math; it is about signal integrity. The automotive environment is electrically hostile. Alternator whine, ignition coil EMI, and extreme cabin temperatures will cause analog sensor readings (like external temperature thermistors or oil pressure sensors) to drift wildly.
Power Rail Stabilization
During engine cranking, vehicle voltage can dip below 9V. If your Arduino and display are powered directly from a standard 12V-to-5V linear regulator (like the L7805), the voltage drop will cause the microcontroller to brownout and reboot, corrupting your EEPROM calibration data.
The Fix: Use an LM2596 buck converter ($4). Crucially, use a multimeter to dial the potentiometer to exactly 5.1V while the engine is running. This 0.1V overhead compensates for the voltage drop across the Schottky protection diode on the Arduino's power input, ensuring a rock-solid 5.0V reaches the ATmega/Teensy logic gates even when the AC compressor kicks on.
Analog Signal Conditioning
For analog sensors (e.g., NTC thermistors for cabin or oil temp), the Arduino's 10-bit ADC is highly susceptible to noise. Implement a hardware low-pass RC filter (a 10kΩ resistor in series with the signal line, and a 0.1µF ceramic capacitor to ground) right at the microcontroller pin. In software, discard the top and bottom 5% of ADC readings from a 20-sample buffer to eliminate EMI spikes before averaging the remaining values.
Real-World Troubleshooting Matrix
| Symptom on Display | Root Cause | Calibration / Hardware Fix |
|---|---|---|
| Speedometer freezes at high RPM | Clone ELM327 dropping CAN frames | Upgrade to STN1110; increase serial buffer size to 256 bytes. |
| GPS speed lags behind OBD2 by 2 seconds | Using software serial for GPS at 9600 baud | Move GPS to hardware UART; configure GPS module to 115200 baud and 1Hz update rate. |
| Coolant temp reads 15°F low | Voltage divider resistor thermal drift | Use 1% tolerance metal film resistors; apply Steinhart-Hart equation calibration in code. |
| Display reboots when starting car | Voltage brownout during cranking | Switch to LM2596 buck converter set to 5.1V; add 1000µF capacitor on 5V rail. |
Conclusion
A truly professional Arduino car display requires moving beyond simple 'read and print' serial sketches. By applying tire-size correction factors to OBD2 PIDs, fusing GPS and VSS data streams, mapping non-linear fuel tanks, and stabilizing your power rails, you bridge the gap between a fragile DIY prototype and a reliable, track-ready digital dash. Take the time to log your raw data to an SD card during a test drive, build your calibration matrices, and your custom display will rival factory telemetry systems costing thousands of dollars.