
Mastering the Serial Plotter in Arduino IDE
When developing embedded systems, staring at a scrolling wall of text in the Serial Monitor is an inefficient way to analyze analog signals, sensor noise, or control loop stability. The serial plotter Arduino tool, built directly into the Arduino IDE, transforms raw serial strings into real-time, visual line graphs. Whether you are tuning a PID controller for a brushless DC motor, analyzing IMU drift on an MPU6050, or simply mapping the response curve of a thermistor, the Serial Plotter is an indispensable diagnostic utility.
In modern development environments like Arduino IDE 2.3 and later, the plotter has evolved significantly from its 1.x legacy counterpart. It now features automatic Y-axis scaling, dark mode integration, legend generation, and CSV data export. However, leveraging these features requires a precise understanding of serial syntax, baud rate bottlenecks, and buffer management. This configuration guide will walk you through the exact setup, syntax rules, and advanced troubleshooting techniques required to get clean, actionable data visualizations from your microcontroller.
Core Configuration and Syntax Rules
The Serial Plotter does not read binary data or complex JSON objects natively; it parses plain text strings sent over the serial port. To render a graph correctly, your C++ sketch must format the output using specific delimiters. The fundamental rule is that the plotter expects a newline character (\n or \r\n) to denote the end of a data frame and the X-axis progression.
Single vs. Multi-Variable Plotting
Plotting a single variable, such as a potentiometer reading, is straightforward. You simply use Serial.println(value);. However, most real-world applications require comparing multiple variables simultaneously—such as plotting a raw sensor reading against a filtered output.
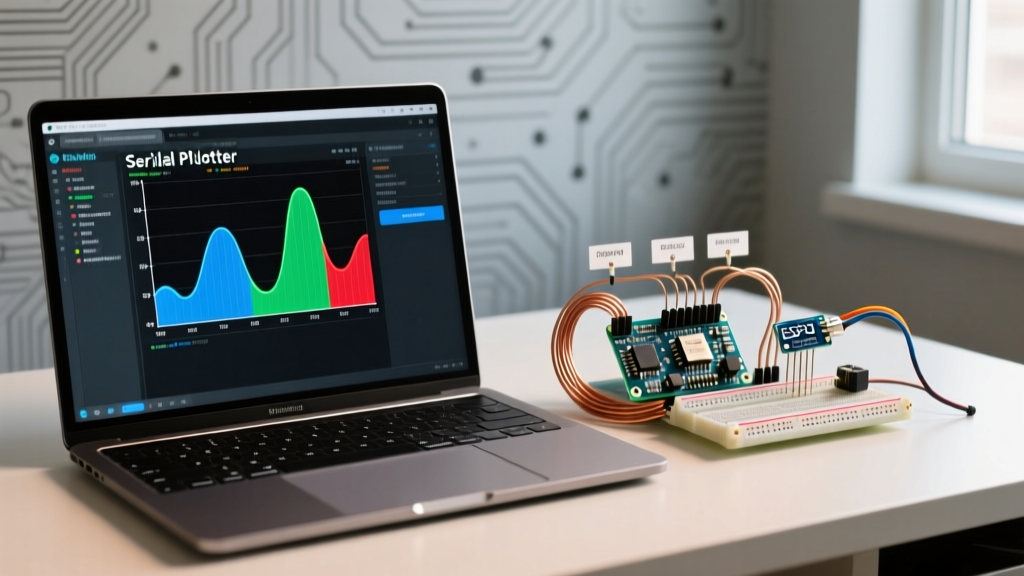
To plot multiple variables on the same graph, you must separate them with a comma. The Serial Plotter will automatically assign a distinct color to each variable and generate a legend at the top of the window.
// Multi-variable plotting syntax
Serial.print(rawTemp);
Serial.print(",");
Serial.print(filteredTemp);
Serial.print(",");
Serial.println(setpoint); // The last variable MUST use println to close the frame
Pro-Tip for Custom Legends: In Arduino IDE 2.x, you can name your variables directly in the serial stream by prefixing the value with a string and a colon. For example: Serial.print("Raw:"); Serial.print(rawTemp); Serial.print(","); Serial.print("Filt:"); Serial.println(filteredTemp);. This eliminates the guesswork of identifying which colored line corresponds to which variable.
Syntax Matrix: Formatting for the Plotter
| Desired Output | C++ Serial Syntax | Plotter Behavior |
|---|---|---|
| Single Line Graph | Serial.println(val1); |
Plots one line, auto-scales Y-axis. |
| Multiple Lines (Unnamed) | Serial.print(val1); Serial.print(","); Serial.println(val2); |
Plots two lines, assigns generic legend names (e.g., '1', '2'). |
| Multiple Lines (Named) | Serial.print("A:"); Serial.print(val1); Serial.print(","); Serial.print("B:"); Serial.println(val2); |
Plots two lines, legend displays 'A' and 'B'. |
| Space Delimited (Legacy) | Serial.print(val1); Serial.print(" "); Serial.println(val2); |
Works in IDE 2.x, but comma is the recommended standard for CSV export. |
Advanced Configuration: High-Speed Sampling & Baud Rates
A common failure mode when using the serial plotter Arduino tool is graph stuttering, dropped frames, or complete microcontroller lockups. This is almost always caused by a mismatch between the sensor sampling rate and the serial transmission bottleneck. According to SparkFun's guide to serial communication, asynchronous serial transmission sends data one bit at a time, meaning a 9600 baud rate can only transmit roughly 960 bytes per second.
Calculating Bandwidth Requirements
If you are sampling an accelerometer at 500 Hz and outputting three axes (X, Y, Z) with 4 digits each plus delimiters, each frame is approximately 20 bytes. At 500 Hz, you are pushing 10,000 bytes per second. A 9600 baud connection will immediately overflow the Arduino's 64-byte hardware serial TX buffer, causing the Serial.print() function to block execution and freeze your sketch.
Baud Rate Configuration Table
| Application Scenario | Target Sampling Rate | Recommended Baud Rate | Hardware Considerations |
|---|---|---|---|
| Slow Environmental Sensors (DHT22, BME280) | 1 - 5 Hz | 9600 | Any MCU, SoftwareSerial is acceptable. |
| PID Control Loops (Motor Encoders) | 50 - 100 Hz | 115200 | Hardware Serial required. Ensure USB cable is shielded. |
| Audio / Vibration Analysis (MEMS Mics) | 1000+ Hz | 500000 - 2000000 | ESP32/Teensy required. UNO R3 USB-to-Serial chip will bottleneck. |
For high-frequency plotting on 32-bit boards like the ESP32 or Arduino Nano 33 BLE, configure your serial initialization to Serial.begin(921600); or higher, and ensure your PC's USB hub can handle the sustained throughput without dropping packets.
Real-World Application: PID Tuning and IMU Filtering
The true power of the serial plotter Arduino utility shines in closed-loop control and signal processing. When tuning a PID controller using the standard Arduino Serial library, you need to visualize the 'Integral Windup' phenomenon. By plotting the Setpoint, Input (Process Variable), and Output (Control Effort) simultaneously, you can visually confirm if the integral term is accumulating excessively during saturation.
Similarly, when working with 6-DOF IMUs like the MPU6050 (detailed in Adafruit's MPU6050 overview), raw accelerometer data is plagued by high-frequency mechanical noise. By plotting the raw Z-axis acceleration alongside a complementary filter output, you can tweak the filter's alpha coefficient in real-time and watch the phase delay and noise rejection change on the graph instantly.
Troubleshooting Common Plotter Failures
Even with perfect syntax, environmental and hardware factors can disrupt your data visualization. Follow this diagnostic flowchart when the plotter misbehaves:
- The Plotter Window is Completely Blank: Verify that the baud rate in the top-right dropdown of the Serial Plotter exactly matches the
Serial.begin()value in your sketch. Also, ensure no other application (like a Python script or 3D printer host) is holding the COM port open. - The Graph is a Flat Line at Zero: Check your variable types. If you are performing integer division (e.g.,
int result = 5 / 10;), C++ will truncate the result to 0. Cast your variables tofloatbefore printing. - Extreme Y-Axis Spikes (The 'Jitter' Effect): The plotter auto-scales based on the visible window. If a single noisy spike hits 5000 while your normal signal is 0-5, the auto-scaler will compress your actual data into a flat line at the bottom of the screen. Implement a software clamp in your code:
val = constrain(val, 0, 1023);before printing to reject out-of-bounds noise. - Graph Looks Like a Solid Block of Color: You are sampling too fast for the plotter's rendering engine. The IDE plotter refreshes at roughly 30-60 FPS. If you send 10,000 data points per second, the plotter overdraws the same pixels, creating a solid block. Use a non-blocking timer (via
millis()) to throttle yourSerial.print()statements to roughly 50-100 Hz for visual clarity, while running your control loop at the higher native frequency.
Beyond the IDE: Third-Party Alternatives for 2026
While the native serial plotter Arduino tool is excellent for quick debugging, professional embedded engineers often require data logging, FFT analysis, and multi-device synchronization. If your project outgrows the IDE's built-in tool, consider these configurations:
- Teleplot (VS Code Extension): If you use PlatformIO within VS Code, Teleplot offers a vastly superior plotting engine that handles millions of data points without lag, supports mathematical operations on the fly, and allows CSV export.
- Meguno: A dedicated Windows application designed specifically for Arduino data visualization. It includes built-in PID tuning interfaces and logging to disk, making it ideal for long-duration thermal or battery discharge testing.
- Processing / Python (Matplotlib): For custom dashboards, reading the serial port via Python's
pyseriallibrary and piping the data into Matplotlib or Plotly gives you absolute control over the UI, allowing you to build bespoke testing jigs for manufacturing environments.
By mastering the syntax, respecting serial bandwidth limits, and applying software constraints to your data streams, the Serial Plotter transforms from a basic debugging novelty into a rigorous engineering instrument.