
Why Move Beyond Serial.print()?
For most makers starting with microcontrollers, Serial.println() is the default debugging tool. While useful for logging sensor data, serial printing fundamentally alters program timing, bloats compiled binary size, and cannot pause execution to inspect memory states. When building complex state machines, RTOS (FreeRTOS) tasks, or interrupt-driven applications on the ESP32, you need hardware-level visibility.
This is where JTAG (Joint Test Action Group) debugging becomes indispensable. By utilizing the ESP32's built-in JTAG interface, you can set hardware breakpoints, step through code line-by-line, inspect CPU registers, and monitor real-time variable states without adding a single line of logging code to your sketch. Thanks to the architectural overhaul in Arduino IDE 2.x, JTAG debugging ESP32 in Arduino IDE is now a native, visual experience, abstracting away the complex OpenOCD command-line configurations that previously hindered beginners.
Hardware Requirements and Adapter Selection
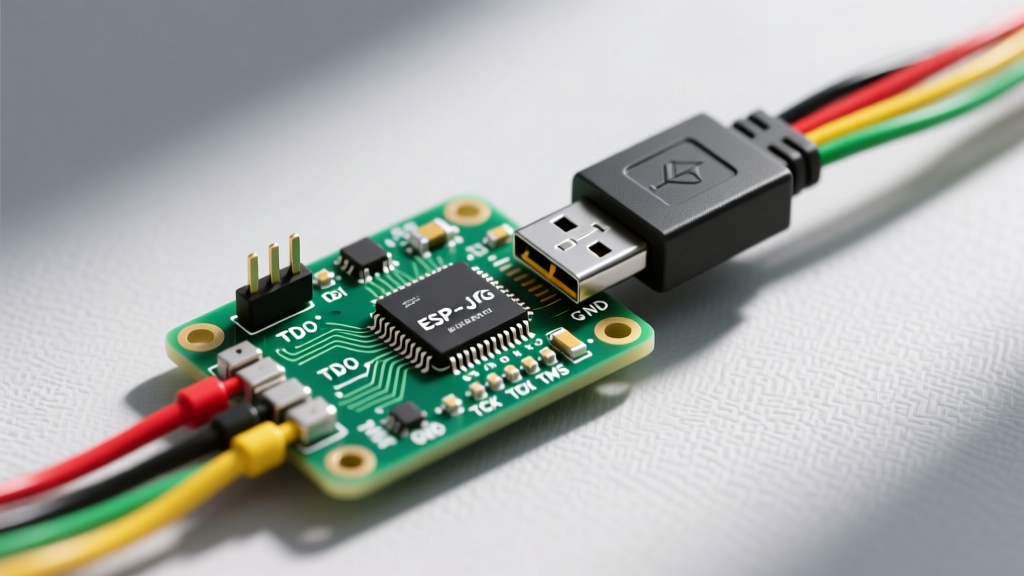
To perform JTAG debugging, the ESP32 requires an external debug probe to bridge the USB connection from your PC to the chip's internal TAP (Test Access Port). While the ESP32-S3 and ESP32-C3 feature native USB-JTAG interfaces, the original ESP32 (Xtensa LX6) requires an external adapter. Below is a comparison of the most reliable probes available in 2026.
| Debug Probe | Core Chipset | Avg. Price (2026) | Best Use Case |
|---|---|---|---|
| Official ESP-PROG | FT2232H | $14.00 - $18.00 | Best for beginners; includes auto-provisioning and isolated power. |
| Generic FT2232H Breakout | FT2232H | $6.50 - $9.00 | Budget DIY builds; requires manual wiring and external 3.3V logic. |
| Segger J-Link EDU Mini | Custom ASIC | $18.00 - $22.00 | Multi-architecture labs; vastly superior flash upload speeds. |
Recommendation: For beginners, the official ESP-PROG is highly recommended. It features an onboard 5V-to-3.3V LDO regulator to safely power your ESP32 during debugging and handles the complex strapping pin states automatically.
The Wiring Matrix and the Strapping Pin Trap
The original ESP32 dedicates four specific GPIO pins to the JTAG interface. These pins are hardcoded in silicon and cannot be remapped. Proper wiring is critical, but beginners frequently encounter a fatal edge case related to ESP32 boot strapping.
Standard JTAG Pinout
- GPIO 14: MTMS (JTAG TMS - Test Mode Select)
- GPIO 12: MTDI (JTAG TDI - Test Data In)
- GPIO 13: MTCK (JTAG TCK - Test Clock)
- GPIO 15: MTDO (JTAG TDO - Test Data Out)
- GND: Common Ground (Mandatory)
- 3.3V: VREF (Required by some adapters to sense logic levels)
⚠️ CRITICAL EDGE CASE: The GPIO 12 Strapping Pin Conflict
GPIO 12 (MTDI) is a strapping pin that dictates the flash memory voltage during boot. If GPIO 12 is pulled HIGH during power-on or reset, the ESP32 configures its internal LDO to output 1.8V to the SPI flash. Since 99% of ESP32 dev boards use 3.3V flash, the chip will fail to read the bootloader and enter an infinite bootloop. Many generic FT2232H adapters pull TDI high by default. If your ESP32 bootloops when the JTAG adapter is connected, you must either add a 10kΩ pull-down resistor to GPIO 12 or physically disconnect the TDI wire while pressing the hardware RESET button.
Software Configuration in Arduino IDE 2.x
Arduino IDE 1.8.x does not support visual hardware debugging natively. You must upgrade to Arduino IDE 2.3 or newer, which integrates the Eclipse Theia framework and a visual GDB frontend.
- Install the ESP32 Core: Open the Boards Manager and install the latest
esp32package by Espressif Systems (v3.x or newer). The core includes the pre-compiled OpenOCD binaries required to communicate with the debug probe. - Select Your Board: Go to Tools > Board and select your specific ESP32 module (e.g., ESP32 Dev Module).
- Configure the Debug Port: Navigate to Tools > Debug Port and select your adapter. If using the ESP-PROG or generic FT2232H, select
esp-prog. If using a Segger J-Link, selectjlink. - Set Debug Level: Under Tools > Core Debug Level, set this to
NoneorError. Enabling verbose serial debugging can interfere with JTAG memory tracing and drastically slow down breakpoint stepping. - USB Driver Setup (Windows Only): If Windows fails to recognize the FT2232H adapter, download the OpenOCD ESP32 release package, which includes a pre-configured Zadig utility. Use Zadig to replace the default FTDI driver with the
WinUSBdriver specifically for the adapter's Interface A.
Step-by-Step Debugging Workflow
With the hardware wired and the IDE configured, you are ready to initiate a debug session.
- Set a Breakpoint: Click in the left margin next to a line of code in your
loop()or a custom function. A red circle will appear, indicating a hardware breakpoint. - Start Debugging: Instead of the standard 'Upload' arrow, click the Debug icon (a bug with a play button) in the top toolbar. Alternatively, press
Shift + F5. - Compilation and Flashing: The IDE will compile your sketch with debug symbols (
-g3 -Ogflags), launch the OpenOCD server in the background, and flash the binary via the JTAG interface (which is significantly faster than standard serial UART flashing). - Inspect State: When execution hits your breakpoint, the IDE will pause. Use the Variables panel to inspect local and global memory, the Call Stack to trace FreeRTOS task origins, and the Peripherals tab to view live hardware register states (like GPIO output matrices or I2C status flags).
Common Failure Modes and Troubleshooting
Hardware debugging introduces physical variables that software-only developers rarely face. Here is how to resolve the most common errors encountered when JTAG debugging ESP32 in Arduino IDE.
1. OpenOCD Fails to Connect (libusb_open() failed)
Cause: The operating system's default USB driver is claiming the FT2232H adapter, preventing OpenOCD from accessing the raw USB endpoints.
Solution: On Windows, use Zadig to install WinUSB. On Linux, you must add custom udev rules to grant non-root users access to the FTDI chip. Create a file at /etc/udev/rules.d/60-openocd.rules and add: ACTION!="add|change", GOTO="openocd_rules_end" followed by the specific VID/PID attributes for the FT2232H.
2. Target Not Halted / Breakpoints Ignored
Cause: The ESP32 has a limited number of hardware breakpoints (typically two for the Xtensa architecture). If you set five breakpoints in the IDE, the debugger silently fails to halt on the last three.
Solution: Limit active breakpoints to two. If you need more, rely on software breakpoints, though these are not supported in flash memory (ROM) on the ESP32, only in RAM-resident code.
3. GDB Server Timeout During Flash
Cause: The JTAG clock speed (TCK) is set too high for the physical wire length between the adapter and the ESP32, causing signal reflection and data corruption.
Solution: Keep JTAG ribbon cables under 10cm. If you must use longer wires, access your platform.local.txt or custom OpenOCD config file and reduce the adapter speed from the default 20,000 kHz to adapter speed 5000.
Final Thoughts on RTOS Debugging
Mastering JTAG debugging ESP32 in Arduino IDE transforms how you approach firmware development. When working with ESP-IDF or the Arduino FreeRTOS implementation, serial prints often cause race conditions or watchdog resets due to the blocking nature of UART transmission. JTAG allows you to pause a specific task, inspect the heap memory for fragmentation, and resume execution without disrupting the timing of concurrent ISR (Interrupt Service Routines). Invest the $15 in an ESP-PROG, wire it carefully respecting the strapping pins, and leverage the visual debugger to write robust, production-ready embedded code.