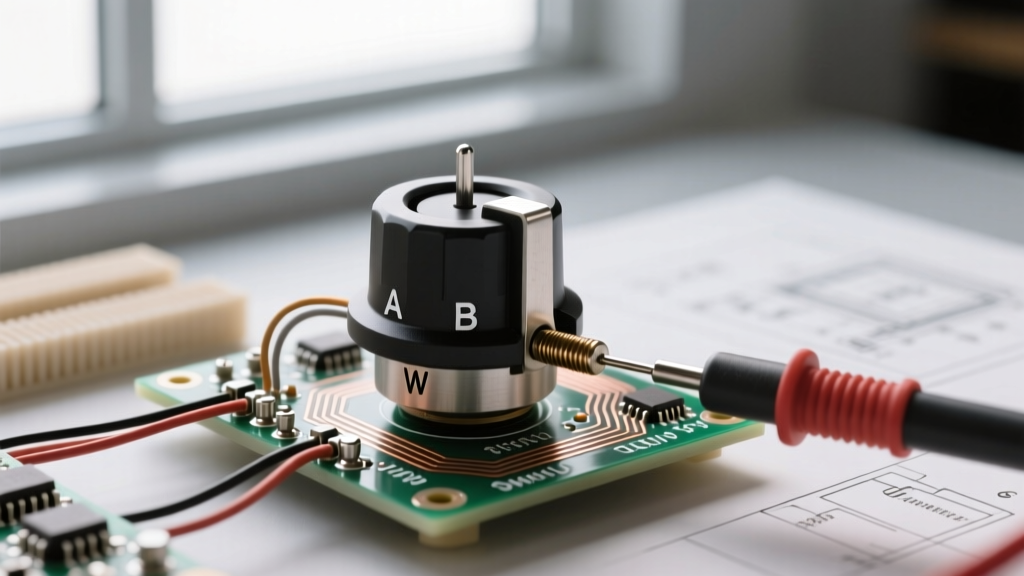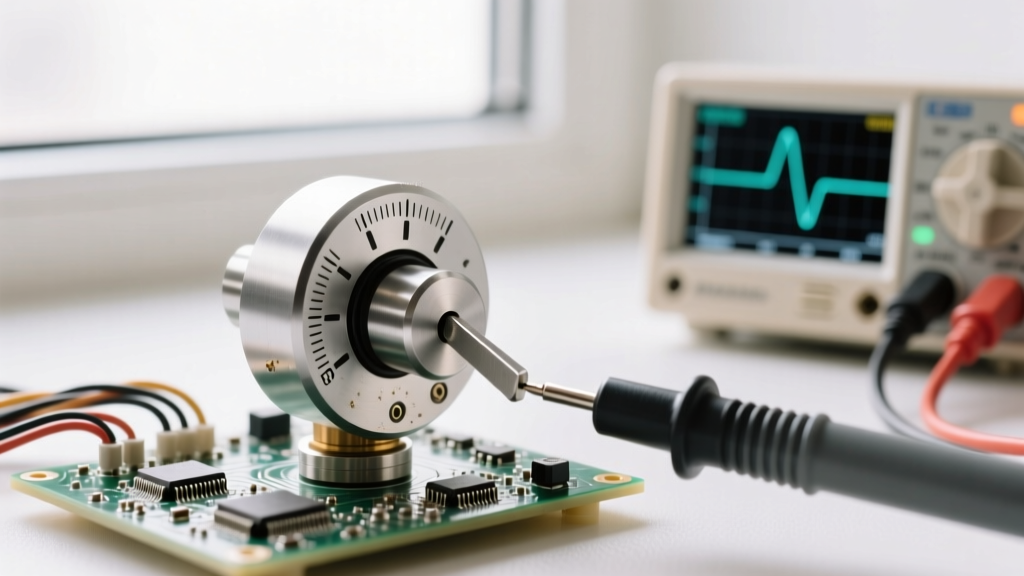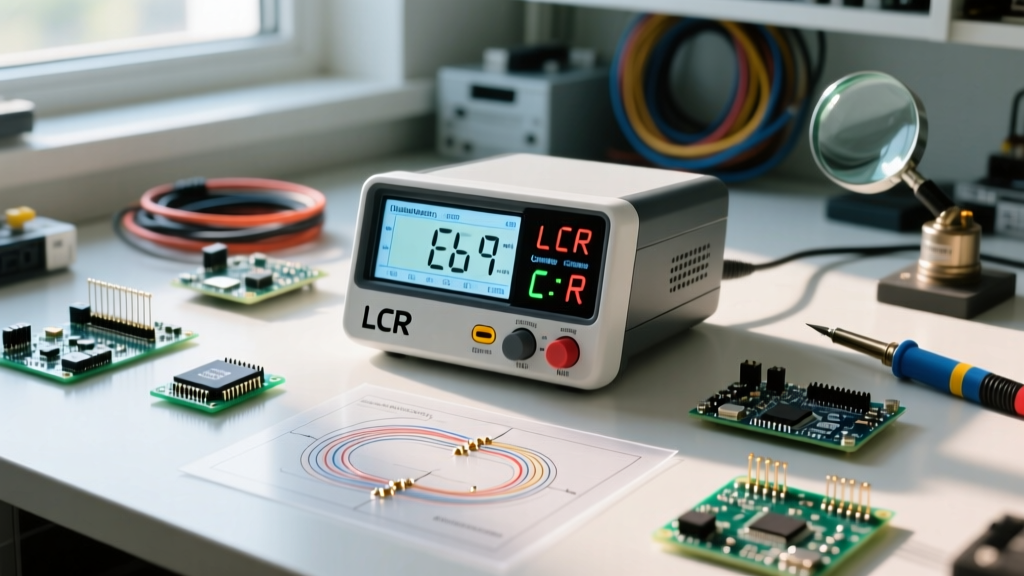
In the fast-paced world of 2026 PCB prototyping and high-speed digital design, guessing component values based on printed markings is a recipe for signal integrity failures. Supply chain substitutions, counterfeit parts, and environmental degradation mean that engineers must rigorously test their inventory. When a precision instrument verifies electronic component parameters, it bridges the gap between theoretical schematic design and real-world electrical behavior. The cornerstone of this verification process is the LCR meter.
Unlike a standard digital multimeter (DMM) that only measures basic DC resistance and continuity, an LCR meter applies alternating current (AC) at specific frequencies to measure Inductance (L), Capacitance (C), and Resistance (R). This comprehensive guide explores the physics, methodology, and practical applications of using LCR meters to ensure your prototyping bin is stocked with genuine, healthy components.
The Physics of Component Verification
Every passive component possesses parasitic elements. A real-world capacitor is not just a pure capacitance; it is a complex impedance network featuring Equivalent Series Resistance (ESR), Equivalent Series Inductance (ESL), and parallel leakage resistance. To accurately evaluate these traits, modern LCR meters utilize an auto-balancing bridge method. The device applies an AC test voltage (typically 0.5 Vrms to 1.0 Vrms) to the Device Under Test (DUT) and measures both the magnitude of the resulting current and the phase angle difference between the voltage and current waveforms.
By calculating the complex impedance (Z = R + jX), the meter's internal DSP algorithms can separate the real (resistive) and imaginary (reactive) parts of the component. This is how the equipment verifies electronic component integrity far beyond what a simple continuity test can achieve, exposing hidden parasitics that could ruin a high-frequency RF circuit or cause excessive ripple in a power delivery network (PDN).
Core Parameters Evaluated During Testing
Capacitance (C) and Dissipation Factor (D)
Capacitance measures a component's ability to store electrical charge. However, verifying capacitance alone is insufficient. The Dissipation Factor (D), also known as the loss tangent, indicates how much energy is lost as heat within the dielectric material. A high D factor in an aluminum electrolytic capacitor often signals dried-out electrolyte or impending thermal failure.
Inductance (L) and Quality Factor (Q)
For inductors and ferrite beads, the LCR meter measures the ability to store energy in a magnetic field. The Quality Factor (Q) is the reciprocal of the Dissipation Factor. A high Q factor is critical for resonant LC tanks and RF filters. If an inductor's Q factor drops unexpectedly, it may indicate shorted turns within the coil winding or core material degradation.
Resistance (R) and Equivalent Series Resistance (ESR)
While DC resistance (DCR) is easily measured with a multimeter, ESR represents the AC resistive losses at specific operating frequencies. ESR is the primary metric used to determine the health of decoupling capacitors in microprocessor power rails. As capacitors age, their internal chemical composition breaks down, causing ESR to spike long before the actual capacitance value drops noticeably.
Hardware Matrix: Top LCR Meters for 2026 Prototyping Labs
Selecting the right tool depends on your required test frequencies and budget. Below is a comparison of industry-standard meters used by hobbyists and professional labs alike.
| Model | Type | Test Frequencies | Basic Accuracy | Approx. Price (2026) |
|---|---|---|---|---|
| DER EE DE-5000 | Handheld | 100Hz, 120Hz, 1kHz, 10kHz, 100kHz | ±0.5% | $135 |
| Siglent ST5 | Handheld | 100Hz, 120Hz, 1kHz, 100kHz | ±0.3% | $169 |
| Keysight E4980AL | Benchtop | 20Hz to 300kHz (up to 1MHz opt) | ±0.05% | $2,450+ |
For most DIY electronics and standard audio-frequency prototyping, the handheld LCR meters offer exceptional value. However, if you are designing RF matching networks or high-speed digital interconnects, a benchtop unit capable of 1 MHz or higher is mandatory to properly characterize parasitic inductance and self-resonant frequencies.
Step-by-Step: Verifying a Multi-Layer Ceramic Capacitor (MLCC)
MLCCs are notorious for exhibiting severe DC bias characteristics, particularly Class II dielectrics like X7R and X5R. A 10µF X7R capacitor might only provide 2µF of actual capacitance when 50V DC is applied across it. Here is how to properly test them:
- Select the Correct Frequency: For capacitance values below 100nF, set the LCR meter to 1 MHz. For values above 100nF, drop the frequency to 100 Hz or 120 Hz to avoid the influence of parasitic ESL.
- Set the Test Signal Level: Configure the AC test voltage to 0.5 Vrms or 1.0 Vrms. Setting it too high can induce microphonic effects or non-linear dielectric responses in certain ceramic materials.
- Perform Open/Short Calibration: Before attaching the DUT, use the meter's calibration function with the test leads open (unconnected) and shorted (tweezers touching) to nullify the parasitic capacitance and resistance of your test fixture.
- Measure and Compare: Clamp the component firmly with Kelvin tweezers. Compare the reading against the manufacturer's datasheet, paying special attention to the tolerance band and the DC bias curves provided by manufacturers like Murata or TDK.
Diagnosing Hidden Failure Modes
When an LCR meter verifies electronic component health, it often uncovers failure modes that visual inspection completely misses. Understanding these edge cases is vital for troubleshooting legacy boards or vetting surplus parts.
- Dielectric Absorption (Soakage): Common in older film and electrolytic capacitors, this occurs when the dielectric material slowly absorbs charge and releases it after the component is discharged. While hard to measure directly with a basic LCR meter, an unusually high Dissipation Factor (D) at low frequencies is a strong indicator of degraded dielectric health.
- Piezoelectric Microphonics in Class II Ceramics: X7R and Y5V capacitors exhibit piezoelectric properties. If your LCR readings fluctuate wildly when the component is subjected to mechanical vibration or acoustic noise, the dielectric is highly microphonic, making it unsuitable for low-noise analog front-ends or audio coupling circuits.
- Inductor Core Saturation and Cracking: Ferrite core inductors can suffer from microscopic cracks due to thermal cycling. This alters the magnetic permeability of the core. If an inductor measures the correct DC resistance but shows a 15% to 20% drop in inductance (L) compared to its datasheet value, the core is likely compromised.
Expert Troubleshooting Tips for the Workbench
Pro Tip: Never attempt to measure a capacitor while it is still soldered in-circuit. The parallel impedance of surrounding traces, resistors, and semiconductor junctions will completely invalidate your LCR readings. Always desolder at least one leg of the component to isolate it from the PCB network before verification.
Furthermore, temperature plays a massive role in component verification. If you are testing NTC thermistors or temperature-compensating capacitors (like C0G/NP0 ceramics), ensure your testing environment is stabilized at 25°C (77°F). Holding a component in your fingers for more than a few seconds will transfer body heat, skewing the resistance and capacitance readings of highly sensitive parts.
Conclusion
In an era where component authenticity and long-term reliability are paramount, relying solely on visual markings is no longer acceptable engineering practice. Whether you are debugging a noisy power supply or characterizing RF filters for an IoT transceiver, utilizing an LCR meter ensures that every passive part behaves exactly as your simulation software expects. By mastering test frequencies, understanding parasitic elements, and recognizing dielectric-specific failure modes, you elevate your prototyping workflow from guesswork to precision science.
For further reading on advanced impedance measurement techniques and fixture calibration, consult the comprehensive LCR meter resources provided by Keysight Technologies, which remain the gold standard for high-frequency component characterization.