Bridging the Gap Between Datasheets and Test Benches
Reading a PDF is only the first step in component validation. For hardware engineers and technicians, extracting actionable electronic component data from manufacturer datasheets and translating it into precise test equipment configurations is where real quality control begins. In 2026, with supply chain variations and counterfeit components still posing risks, relying on a basic digital multimeter (DMM) is insufficient. Precision testing requires mapping parametric tables directly to the setup variables of LCR meters, curve tracers, and automated test equipment (ATE).
This guide explores how to decode electronic component data to establish rigorous testing protocols, avoid destructive failure modes, and ensure your prototypes and production runs meet exact specifications.
Absolute Maximums vs. Recommended Operating Conditions
A common pitfall in component testing is misunderstanding the boundary between 'Absolute Maximum Ratings' and 'Recommended Operating Conditions.' According to the Analog Devices Guide to Reading Datasheets, absolute maximums are stress ratings, not functional operating points. Testing a component at its absolute maximum voltage or temperature to 'verify' its datasheet claims often results in latent damage or immediate catastrophic failure.
Establishing Safe Test Limits
When configuring your test fixture or power supply limits, always apply a derating factor to the recommended operating conditions, not the absolute maximums. For example, if an operational amplifier's recommended supply voltage is ±15V (30V total) and the absolute maximum is ±18V (36V total), your automated test script should trigger an over-voltage fault at 16V per rail. This provides a safe buffer that validates the component's operational ceiling without risking junction breakdown.
Configuring LCR Meters Using Capacitor Datasheets
Multi-Layer Ceramic Capacitors (MLCCs) are notoriously sensitive to test conditions. The capacitance value printed on the reel is only valid under the specific electronic component data conditions listed in the manufacturer's test specifications. If you measure a 10µF X7R MLCC with a standard DMM or a low-end LCR meter, you might read 4µF and assume the component is defective or counterfeit. In reality, you are likely testing it under the wrong bias and frequency conditions.
The Voltage Coefficient of Capacitance (VCC)
Class II dielectrics (like X5R and X7R) exhibit severe capacitance drop under DC bias. To properly test these components, you must extract the VCC data from the datasheet and configure a benchtop LCR meter—such as the Keysight E4980AL (priced around $4,500) or the more affordable Wayne Kerr 6400B ($1,800)—to apply a simultaneous DC bias during the AC measurement.
- Test Frequency: Datasheets typically specify 1 kHz for capacitances >10µF, and 1 MHz for values <1µF. Set your LCR meter accordingly.
- AC Signal Level: Standard test levels are 0.5 Vrms or 1.0 Vrms. Exceeding this can cause microphonic effects or dielectric saturation in high-K ceramics.
- DC Bias: Use the datasheet's VCC curve to determine expected capacitance at your circuit's operating voltage. If the datasheet shows a 40% drop at 10V DC bias, your pass/fail limit on the LCR meter must be adjusted to reflect this physical reality, not the nominal 0V value.
Semiconductor Curve Tracing and V-I Parametric Data
When validating bipolar junction transistors (BJTs) or MOSFETs, static resistance checks are useless. You must verify the dynamic V-I (Voltage-Current) characteristics. Electronic component data sheets provide graphs for Forward Transconductance (gfs) and DC Current Gain (hFE), but these are highly dependent on collector current (Ic) and temperature.
Setting Up the Curve Tracer
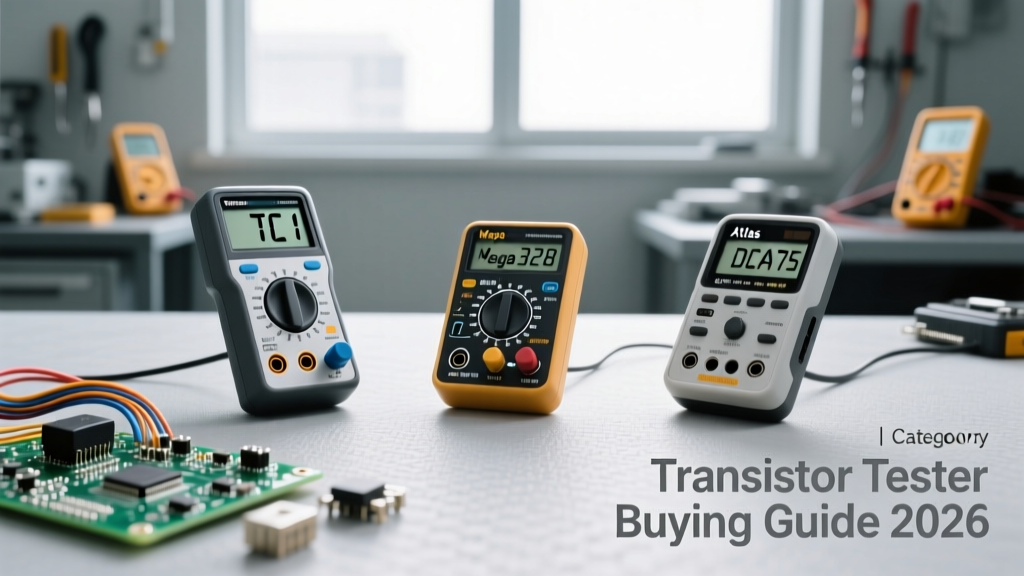
Using a tool like the Peak Atlas DCAPro ($245) for quick bench checks or a Tektronix CT3700A ($15,000+) for production ATE, you must configure the base current step size based on the datasheet's 'Ic vs. Ib' graph. If the datasheet shows hFE peaking at an Ic of 150mA, your curve tracer's sweep must include that specific operating point. Testing hFE only at the default 2mA test current of a cheap DMM will yield data that is entirely irrelevant to a power switching application, leading to incorrect thermal management designs.
Mapping Datasheet Parameters to Test Equipment Settings
To streamline your testing workflow, use the following matrix to translate standard electronic component data into physical test equipment configurations.
| Component Type | Datasheet Parameter | Required Test Equipment | Critical Setup Variable |
|---|---|---|---|
| MLCC (X7R/X5R) | Capacitance vs. DC Bias | Precision LCR Meter with DC Bias | AC Level: 0.5Vrms, Freq: 1kHz/1MHz |
| Power MOSFET | RDS(on) / Gate Charge (Qg) | Curve Tracer / Parametric Analyzer | Vgs step voltage, Id pulse width (<300µs) |
| Crystal Oscillator | Load Capacitance (CL) / ESR | Network Analyzer / Pi-Network Fixture | Drive level (µW) to avoid overdriving |
| RF Inductor | Self-Resonant Frequency (SRF) | Impedance Analyzer (up to 3GHz) | Open/Short calibration at the fixture plane |
Edge Cases: Parasitics and Thermal Runaway During Testing
One of the most frequent causes of 'failed' component tests is the introduction of fixture parasitics. When testing low-ESR (Equivalent Series Resistance) polymer capacitors or high-frequency RF inductors, the inductance of standard test leads can completely mask the component's actual electronic component data.
The Necessity of 4-Terminal Pair (4TP) Kelvin Connections
For impedances below 10 ohms, you must use a 4TP Kelvin connection. This separates the current-forcing path from the voltage-sensing path, eliminating the resistance and inductance of the test cables from the measurement. According to Keysight LCR Meter Application Guides, failing to perform an open/short/load calibration directly at the tip of the 4TP fixture will result in phase angle errors that make high-Q inductor measurements entirely invalid.
Managing Thermal Runaway in Power Semiconductors
When testing the continuous drain current (Id) of a MOSFET, applying a continuous DC load on a curve tracer will rapidly heat the silicon die. Because RDS(on) has a positive temperature coefficient, the die heats up, resistance increases, and power dissipation spikes in a thermal runaway loop. To extract accurate room-temperature electronic component data for RDS(on), your test equipment must use pulsed current measurements (typically <300µs pulse width with a <1% duty cycle) to prevent self-heating from skewing the results.
Establishing Pass/Fail Limits with Measurement Uncertainty
Setting your ATE pass/fail limits exactly to the datasheet's minimum and maximum values is a statistical error. Every measurement system has inherent uncertainty. The NIST Technical Note 1297 (Guidelines for Evaluating and Expressing the Uncertainty of Measurement Results) outlines the necessity of 'guard banding' in compliance testing.
Pro-Tip: Implement Guard Banding
If a voltage regulator's datasheet specifies an output tolerance of 5.00V ±2% (4.90V to 5.10V), and your DMM's calibrated uncertainty is ±0.5% (±25mV), you must tighten your ATE pass/fail limits to 4.925V and 5.075V. This guard band ensures that a component passing your test is genuinely within spec, accounting for the measurement system's error margin.
Conclusion
Extracting and applying electronic component data is a discipline that separates amateur troubleshooting from professional hardware validation. By respecting the difference between absolute maximums and operating conditions, configuring test equipment to match datasheet VCC and frequency specifications, and applying NIST-backed guard banding to your pass/fail criteria, you ensure that the components on your PCB will perform exactly as engineered. Invest in the right 4TP fixtures, calibrate at the test plane, and let the datasheet dictate your test parameters—not the default settings of your equipment.