The Hidden Cost of Default ESP32 IDE Setups
When developing firmware for the ESP32 family, the choice of your ESP32 IDE directly dictates your iteration speed, debugging capability, and eventual production readiness. Many makers and junior engineers default to the standard Arduino IDE 1.8.x or the newer 2.x without modifying the underlying build environment. While this works for blinking an LED, it creates massive workflow bottlenecks for complex IoT applications involving Wi-Fi provisioning, TLS encryption, and deep sleep management.
The ESP32 is not a simple 8-bit microcontroller; it is a dual-core 240MHz powerhouse (or a high-efficiency RISC-V chip in newer variants) running a custom FreeRTOS implementation. Compiling for this architecture requires the heavy Xtensa or RISC-V GCC toolchains. If your IDE is not configured to cache builds, manage partition tables efficiently, or handle JTAG debugging, you will waste hours waiting for redundant compilations and hunting down memory leaks using rudimentary serial prints.
The Architecture Divide: Xtensa vs. RISC-V Toolchains
Before optimizing your workflow, you must understand how the silicon dictates the IDE behavior. The original ESP32, ESP32-S2, and ESP32-S3 utilize the Xtensa LX6/LX7 architecture. Conversely, the ESP32-C3, ESP32-C6, and ESP32-H2 rely on RISC-V.
When using the Arduino ESP32 Core, the IDE must download and manage distinct toolchains for these architectures. A common failure mode in standard Arduino IDE setups is the timeout error during the initial RISC-V toolchain extraction, which silently corrupts the build environment. By shifting to a more robust ESP32 IDE environment like PlatformIO, these toolchains are isolated in virtual environments, preventing cross-contamination and ensuring that switching from an ESP32-S3 (Xtensa) to an ESP32-C6 (RISC-V) project takes seconds rather than requiring a full IDE restart.
Core Contenders: Arduino IDE 2.x vs. PlatformIO vs. Native ESP-IDF
To optimize your workflow, you must select the right abstraction layer. Below is a benchmark comparison based on a standard 15,000-line IoT sensor project utilizing Wi-Fi, MQTT, and a TFT display driver.
| Feature | Arduino IDE 2.x | PlatformIO (VS Code) | Native ESP-IDF |
|---|---|---|---|
| Clean Compile Time | ~45 seconds | ~38 seconds | ~55 seconds (CMake heavy) |
| Incremental Compile | ~18 seconds | ~4 seconds (with ccache) | ~6 seconds (Ninja build) |
| JTAG Hardware Debugging | Limited (Requires manual config) | Native (OpenOCD integration) | Native (Full Eclipse/VS Code support) |
| Custom Partition Tables | Hidden in AppData folders | Project-root CSV mapping | menuconfig / CSV mapping |
| CI/CD Integration | Poor (arduino-cli required) | Excellent (PlatformIO Core) | Excellent (Idf.py / Docker) |
Workflow Optimization Tactics for PlatformIO
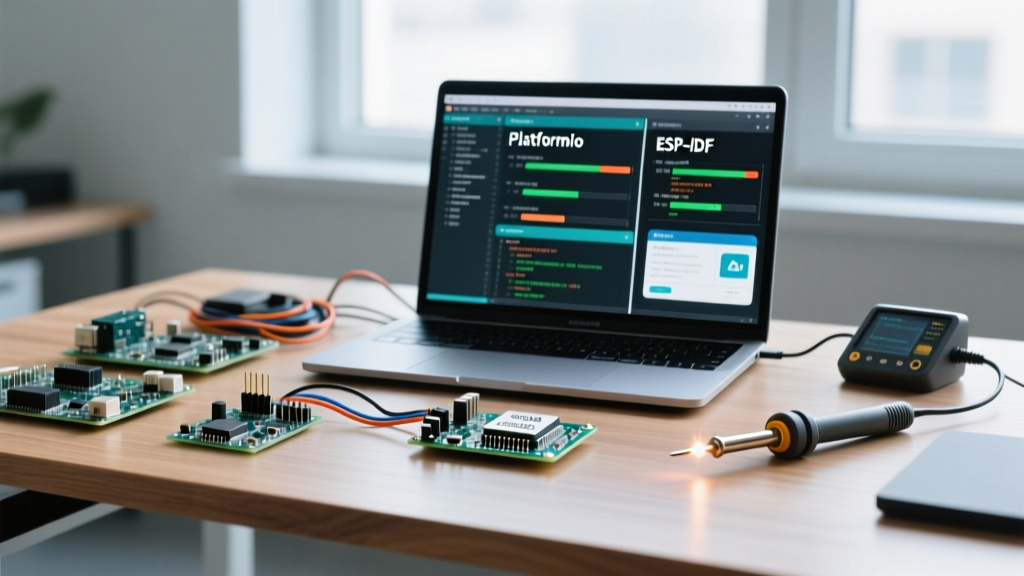
For 90% of professional and advanced hobbyist workflows, PlatformIO inside Visual Studio Code represents the optimal ESP32 IDE sweet spot. It bridges the gap between the ease of the Arduino framework and the raw power of the native ESP-IDF. Here is how to aggressively optimize your platformio.ini file for maximum velocity.
1. Enabling Compiler Caching and Optimization Flags
By default, PlatformIO does not always leverage the compiler cache (ccache) for ESP32 projects, leading to unnecessary recompilation of unchanged libraries. Furthermore, you can instruct the compiler to optimize for size or speed depending on your flash constraints.
[env:esp32-s3-devkitc-1]
platform = espressif32
board = esp32-s3-devkitc-1
framework = arduino
build_flags =
    -O2
    -DCORE_DEBUG_LEVEL=4
    -DBOARD_HAS_PSRAM
build_unflags = -Os
Using -O2 optimizes for execution speed, which is critical when handling high-frequency sensor polling or fast TFT rendering, while unflagging -Os (optimize for size) prevents the compiler from aggressively inlining code in ways that might bloat the IRAM (Instruction RAM), leading to 'IRAM full' panic errors during boot.
2. Automating Partition Table Management
The default Arduino partition table allocates 1.5MB for two OTA (Over-The-Air) app slots. If your firmware includes heavy TLS certificates, large audio buffers, or a substantial LittleFS payload, 1.5MB is insufficient. Instead of digging through hidden AppData folders, define a custom partitions.csv in your project root and link it in your ESP32 IDE configuration:
board_build.partitions = custom_partitions.csv
This allows you to allocate a single 3MB app partition for non-OTA production builds, or dedicate 2MB to SPIFFS/LittleFS for local web server assets, drastically reducing the need to manually erase flash via the Espressif Flash Download Tool.
Surviving the Arduino IDE 2.x Environment
If your team or workflow strictly mandates the Arduino IDE 2.x, you can still salvage your optimization pipeline. The 2.x release introduced a much-needed built-in debugger and an improved Serial Plotter. To optimize this environment:
- Enable Verbose Compilation: Go to File > Preferences and check 'Show verbose output during: compilation'. This is mandatory for diagnosing linker errors when external C++ libraries conflict with the ESP32's FreeRTOS implementations.
- Leverage the Serial Plotter: Instead of writing custom Python scripts to visualize analog sensor data or PID loop tuning, use the built-in plotter. Format your serial output as comma-separated values (e.g.,
Serial.printf("%d,%d\n", target, actual);) to render real-time multi-line graphs directly in the IDE. - Library Dependency Isolation: Arduino IDE 2.x still struggles with global library pollution. If a project requires a specific fork of the
PubSubClientlibrary, place the library folder directly inside the project's root directory rather than the globalDocuments/Arduino/librariesfolder to prevent cross-project version conflicts.
Advanced Debugging: Moving Beyond Serial.print()
The most significant workflow killer in embedded development is relying on serial printing to trace hard faults, watchdog resets, and memory leaks. To truly optimize your ESP32 IDE workflow, you must integrate hardware JTAG debugging.
Expert Insight: The ESP32-S3 and ESP32-C6 feature built-in USB-JTAG interfaces. This means you do not need an external ESP-Prog debugger; a standard USB-C cable connected to the native USB pins is sufficient to halt execution, inspect FreeRTOS task stacks, and set hardware breakpoints directly from your IDE.
According to the Espressif JTAG Debugging Guide, configuring OpenOCD to interface with the internal USB-JTAG peripheral allows you to catch exceptions like 'StoreProhibited' or 'Guru Meditation Errors' at the exact line of C++ code that triggered the fault, rather than staring at a cryptic hex-dump backtrace in the serial monitor.
Decision Matrix: Which ESP32 IDE Fits Your Project?
Use this framework to select your environment based on project lifecycle stages:
- Rapid Prototyping (Hardware Bring-up): Use PlatformIO with the Arduino Framework. The vast ecosystem of Arduino libraries allows you to verify I2C sensors, SPI displays, and basic Wi-Fi connectivity in hours.
- Optimization & Power Tuning: Transition to PlatformIO with the Native ESP-IDF Framework. The Arduino abstraction layer hides critical power-saving configurations. Native ESP-IDF allows you to configure modem sleep, dynamic frequency scaling (DFS), and ULP (Ultra-Low Power) coprocessor tasks via
menuconfig. - Production & Fleet Deployment: Utilize PlatformIO Core via CLI integrated into GitHub Actions. This allows you to compile firmware binaries automatically on every Git commit, run static analysis checks, and push OTA binaries to your AWS or custom MQTT broker without ever opening a GUI IDE.
Reference & Toolchain Resources
Mastering your ESP32 IDE requires continuous reference to the underlying toolchain documentation. Keep these resources bookmarked for resolving obscure linker errors and RTOS task priority conflicts:
- PlatformIO Espressif 32 Documentation - Essential for understanding framework versions, custom board definitions, and OpenOCD configurations.
- ESP-IDF Programming Guide - The definitive source for FreeRTOS task management, Wi-Fi mesh networking, and flash encryption protocols.
By abandoning default settings and intentionally configuring your build flags, partition tables, and debugging interfaces, you transform your ESP32 IDE from a simple code editor into a professional-grade firmware engineering pipeline.