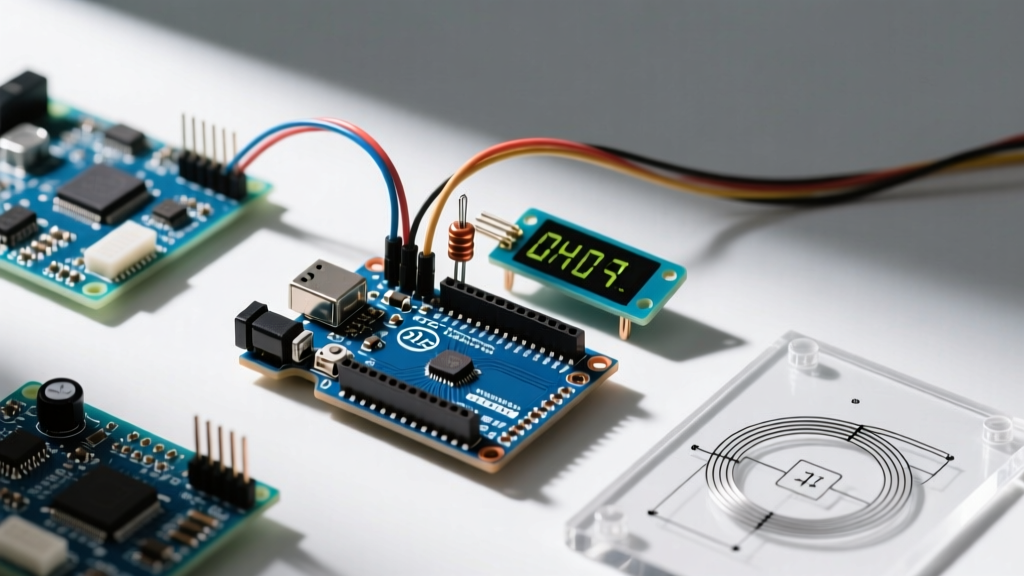
The Hidden Cost of Naive Serial Monitoring
When engineers and makers first learn how to use an Arduino to monitor environmental or kinematic data, the standard approach involves printing comma-separated values (CSV) over a 9600-baud serial connection. While this works for blinking LEDs or reading a single potentiometer, it becomes a severe workflow bottleneck when polling high-frequency sensors like the MPU6050 (IMU) or BME280 (environmental) at rates exceeding 100Hz.
In 2026, edge-computing and real-time telemetry demand optimized data pipelines. Naive serial printing introduces three critical workflow failures:
- Blocking Execution: The ATmega328P (found in the Arduino Uno/Nano) possesses a mere 64-byte hardware UART transmit buffer. Once full,
Serial.print()becomes a blocking function, stalling your main control loop and introducing micro-stutters into PID controllers. - Parsing Overhead: Converting floating-point sensor readings to ASCII strings consumes massive CPU cycles on 8-bit and 32-bit MCUs alike, wasting processing power that could be used for digital signal processing (DSP).
- Manual Data Wrangling: Copy-pasting raw text from the Arduino IDE Serial Monitor into Excel or MATLAB is an unscalable, error-prone workflow.
This guide details how to architect a professional-grade telemetry pipeline, transforming your Arduino from a simple data logger into a high-speed, optimized monitoring node.
Hardware Selection: UART Bridges vs. Native USB CDC
Optimizing your monitoring workflow begins with selecting the right microcontroller architecture. The physical layer of your serial connection dictates your maximum throughput and latency.
| Microcontroller Board | Serial Interface | Max Practical Baud | Approx. Cost (2026) | Workflow Verdict |
|---|---|---|---|---|
| Arduino Nano (ATmega328P) | Hardware UART via CH340/FTDI | 115,200 bps | $6.00 - $9.00 | Poor for high-speed; buffer overflows likely. |
| Arduino Nano 33 IoT (SAMD21) | Native USB CDC | ~2,000,000 bps | $18.00 - $22.00 | Excellent; bypasses hardware UART bottlenecks. |
| ESP32-S3 DevKitC-1 | Native USB OTG / CDC | USB 1.1 Full Speed | $8.00 - $12.00 | Best value; dual-core allows dedicated telemetry tasks. |
| Teensy 4.1 (Cortex-M7) | Native USB 480Mbps | Hardware limited | $32.00 - $35.00 | Overkill for basic monitoring; ideal for DSP + telemetry. |
Pro Workflow Tip: If you must use a legacy 5V Arduino Uno or Nano for an existing hardware setup, upgrade your external USB-to-Serial adapter to an FT232RL-based breakout board. The FT232RL handles baud rates up to 3 Mbps and features deep internal FIFO buffers, drastically reducing the chance of PC-side data drops compared to cheap CH340 clones.
Step 1: Transitioning from ASCII to Binary Structs
The single most impactful optimization you can make when configuring an Arduino to monitor complex systems is abandoning ASCII text payloads. Sending the string "23.45,1013.25,45.00\n" requires 22 bytes. Sending the exact same data as raw binary floats requires only 12 bytes, eliminates string-conversion CPU overhead, and guarantees fixed-length packet frames.
Implementing C-Structs for Telemetry
Define a packed struct in your Arduino sketch to hold your sensor payload. Using #pragma pack ensures the compiler does not insert padding bytes, which is critical when parsing the data on a host PC.
#pragma pack(push, 1)
struct TelemetryPacket {
  uint8_t header;      // 0xAA for sync
  float temperature;
  float pressure;
  float humidity;
  uint16_t checksum;
};
#pragma pack(pop)

TelemetryPacket packet;

void sendTelemetry() {
  packet.header = 0xAA;
  packet.temperature = bme.readTemperature();
  packet.pressure = bme.readPressure() / 100.0F;
  packet.humidity = bme.readHumidity();
  packet.checksum = calculateCRC16(&packet, sizeof(packet) - 2);
  Serial.write((uint8_t*)&packet, sizeof(packet));
}
By utilizing Serial.write() instead of Serial.print(), you push raw memory directly to the USB CDC or UART buffer. This reduces transmission time by up to 60% and standardizes your packet size, making host-side parsing trivial.
Step 2: Visual Telemetry Beyond the IDE
The default Arduino IDE v2 Serial Plotter is a useful starting point, but it lacks the features required for professional workflow optimization, such as data logging, multi-axis scaling, and custom dashboards. To truly optimize how you use an Arduino to monitor live systems, integrate modern visualization tools into your IDE.
The VS Code + Teleplot Workflow
If you develop using PlatformIO within Visual Studio Code, the Teleplot extension is an industry standard for real-time MCU telemetry. Teleplot automatically parses incoming serial data (both ASCII and binary) and renders interactive, zoomable plots without leaving your coding environment.
- Install the Teleplot extension in VS Code.
- Configure your
platformio.inito set the monitor speed:monitor_speed = 115200. - Use Teleplot's built-in serial commands to map incoming binary structs directly to graph axes.
- Export live data to CSV with a single click for post-processing in Python or MATLAB.
This eliminates the context-switching penalty of moving between the Arduino IDE, a terminal emulator, and a spreadsheet, keeping your entire development and monitoring workflow inside a single window.
Step 3: Automating Data Ingestion with Python
For long-term monitoring or automated testing rigs, relying on a GUI plotter is insufficient. You need a headless, automated pipeline. Python, paired with the PySerial library, remains the undisputed king of serial data ingestion.
Below is a highly optimized Python snippet designed to read the binary C-struct defined earlier. Notice the use of the struct module to unpack the raw bytes, and a byte-hunting mechanism to find the 0xAA header, ensuring your script automatically recovers from serial buffer desynchronization.
import serial
import struct
import time

# Initialize high-speed serial connection
ser = serial.Serial('/dev/ttyUSB0', 115200, timeout=1)
packet_format = '

Edge Cases and Troubleshooting
Even with optimized code, physical layer anomalies can disrupt your monitoring workflow. Keep these edge cases in mind when deploying your Arduino to monitor industrial or automotive environments:

1. Ground Loop Noise on Long UART Runs
If your Arduino is monitoring a system located more than 2 meters away, standard TTL UART (TX/RX/GND) will suffer from electromagnetic interference (EMI) and ground potential differences, resulting in corrupted packets. Solution: Use RS-485 transceiver modules (like the MAX485, costing roughly $1.50 each). RS-485 uses differential signaling, allowing reliable telemetry monitoring over distances up to 1,200 meters.

2. USB Hub Latency and Polling Jitter
When monitoring high-frequency vibration data via an ESP32-S3's Native USB CDC, connecting the board through an unpowered or cheap USB 2.0 hub can introduce polling jitter. The host OS may delay reading the USB endpoint buffer, causing the MCU's internal RAM to fill up and trigger a watchdog reset. Solution: Always connect high-speed telemetry nodes directly to the PC's motherboard I/O ports, or use a powered, industrial-grade USB 3.0 hub.

3. Flash Memory Wear from Local Logging
If your workflow involves the Arduino logging data to an onboard SD card or SPIFFS partition while simultaneously transmitting over serial, ensure you are buffering writes. Writing to flash memory byte-by-byte will destroy the flash cells within weeks. Batch your binary structs into 512-byte chunks (matching standard SD card sector sizes) before committing to storage.

Summary: The Optimized Monitoring Stack
Transitioning from a beginner mindset to an optimized engineering workflow requires rethinking how you use an Arduino to monitor the physical world. By upgrading to Native USB CDC hardware, replacing ASCII strings with packed binary structs, and leveraging modern tools like VS Code Teleplot and Python PySerial, you eliminate bottlenecks, prevent data loss, and reclaim hours of manual data wrangling. Implement these architectural shifts today, and your MCU telemetry pipelines will be robust enough for professional 2026 engineering standards.