
Turning Your Microcontroller into an Arduino PC Oscilloscope
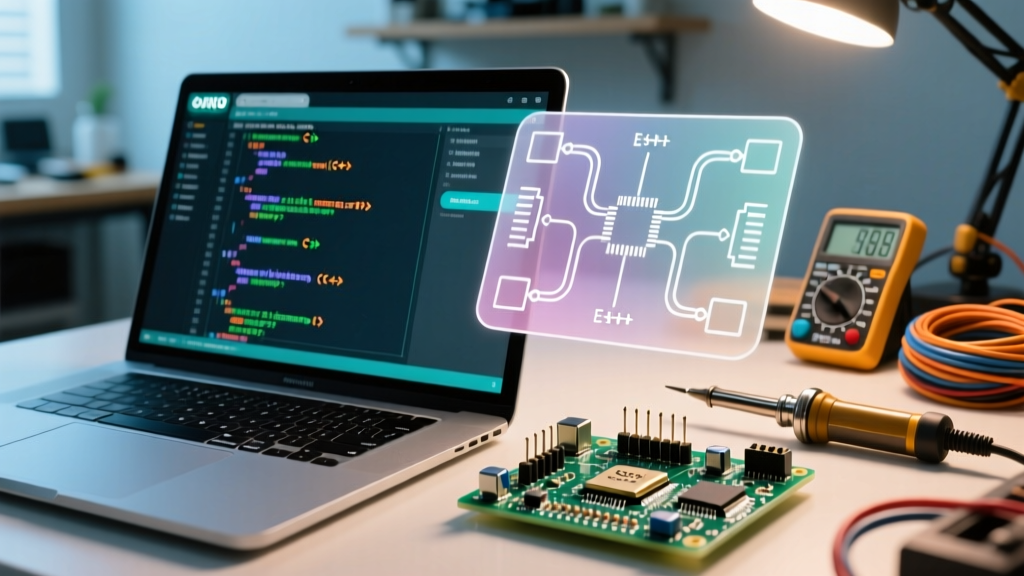
While a dedicated benchtop oscilloscope like the Rigol DS1054Z or Siglent SDS1202X-E remains the gold standard for high-frequency RF diagnostics, building a DIY Arduino PC oscilloscope is an invaluable skill for hobbyists and field engineers. By leveraging the microcontroller's Analog-to-Digital Converter (ADC) and streaming the data to a PC via USB, you can visualize low-frequency waveforms, debug PWM signals, and monitor slow-moving sensor ramps without spending hundreds of dollars.
This guide details the exact hardware, voltage protection circuitry, and firmware prescaler tweaks required to transform a standard ATmega328P-based board into a functional diagnostic tool.
Hardware Selection: ADC Resolution and Sample Rate Limits
The core limitation of any microcontroller-based oscilloscope is the ADC sample rate. According to the Nyquist-Shannon sampling theorem, your sample rate must be at least twice the maximum frequency of the signal you intend to measure. In reality, you need a sample rate 5x to 10x higher to accurately reconstruct the waveform shape on your PC monitor.
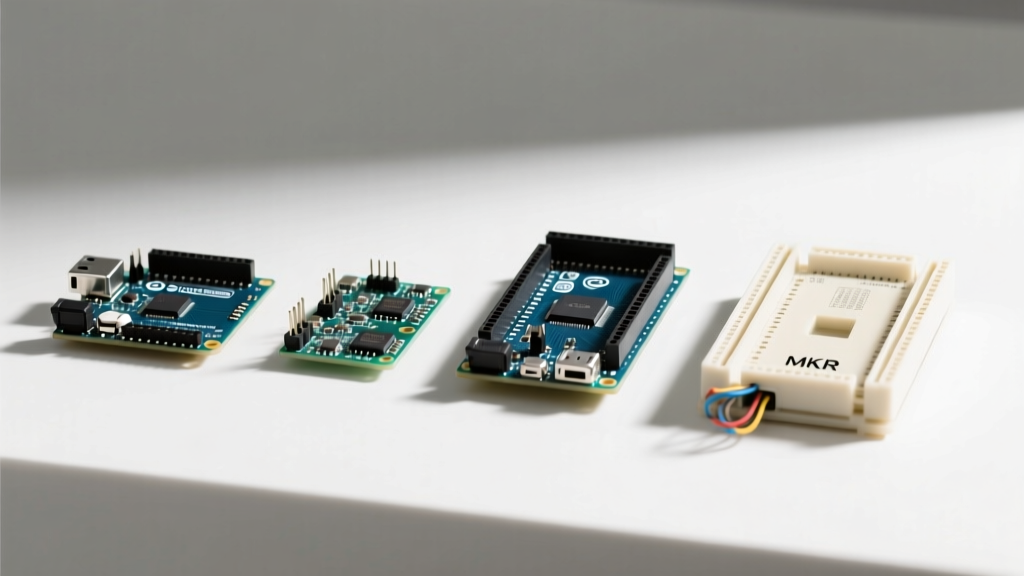
| Microcontroller Board | ADC Resolution | Max Practical Sample Rate | Est. 2026 Price | Best Application |
|---|---|---|---|---|
| Arduino Uno R3 (Clone) | 10-bit | ~76.9 kHz (Prescaler 16) | $12 - $15 | Audio, slow sensors, basic PWM |
| Arduino Uno R4 Minima | 14-bit (12-bit usable) | ~500 kHz | $28 - $32 | Higher fidelity audio, motor control |
| Teensy 4.1 | 12-bit | ~1.0 MSPS | $32 - $35 | Ultrasonic sensors, fast transients |
For this tutorial, we will focus on the ubiquitous ATmega328P (Uno R3/Nano), as it requires specific firmware manipulation to achieve usable oscilloscope speeds, providing excellent insight into MCU architecture.
Step 1: Designing the Safe Input Front-End
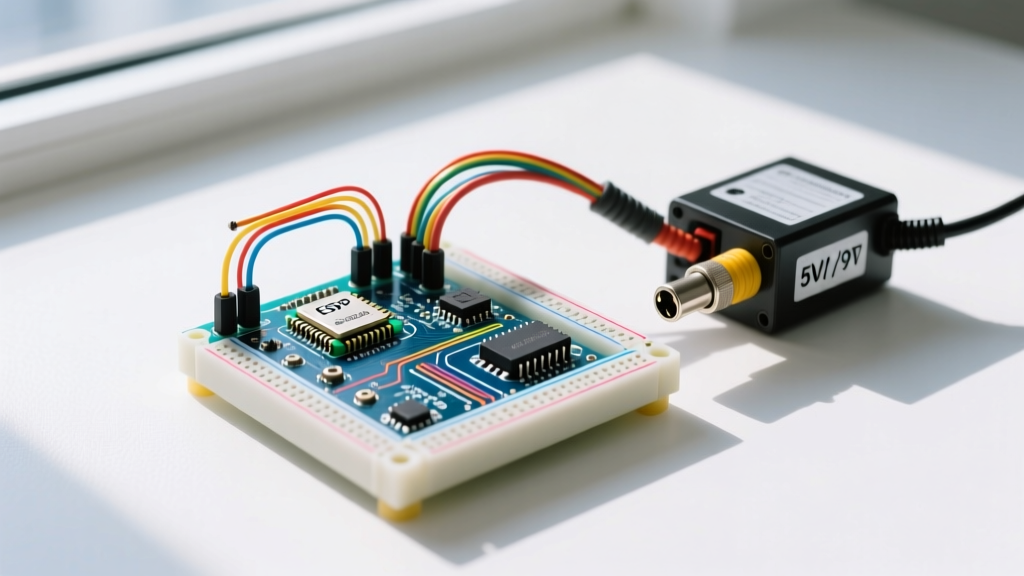
The most common failure mode when building an Arduino PC oscilloscope is frying the ADC pin. The ATmega328P analog pins are strictly limited to 0V–5V. Applying a negative voltage or exceeding 5.5V will permanently damage the silicon.
To safely measure higher voltages (e.g., a 12V car battery or 24V industrial control line), you must build a precision voltage divider with overvoltage clamping.
The 10:1 Voltage Divider with Zener Protection
Instead of a basic resistor pair, we will use a clamped divider. According to SparkFun's voltage divider guide, standard dividers scale voltage linearly, but they offer zero protection if the input spikes.
- R1 (Series Resistor): 91kΩ (1/4W, 1% tolerance metal film)
- R2 (Shunt Resistor): 10kΩ (1/4W, 1% tolerance metal film)
- D1 (Clamp Diode): 5.1V Zener Diode (placed in parallel with R2, cathode to signal, anode to ground)
Calculation: With a 91k/10k ratio, the division factor is 10.1. A 50V input signal will be scaled down to 4.95V, safely within the 5V ADC limit. If a 100V transient hits the probe, the Zener diode clamps the voltage at 5.1V, sacrificing itself to save your microcontroller.
Pro-Tip: Always use 1% tolerance metal film resistors for oscilloscope front-ends. Standard 5% carbon film resistors will introduce severe scaling errors, making your PC software voltage readouts inaccurate by up to 10%.
Step 2: Overclocking the ADC Prescaler
By default, the Arduino analogRead() function is configured for maximum accuracy, not speed. The ATmega328P runs at 16MHz, and the default ADC prescaler is set to 128. This yields an ADC clock of 125kHz. Since a 10-bit conversion takes 13 ADC cycles, the default sample rate is a sluggish 9.6kHz.
To turn this into a viable Arduino PC oscilloscope, we must manipulate the ADCSRA (ADC Control and Status Register A) to lower the prescaler to 16. This pushes the ADC clock to 1MHz, yielding a sample rate of roughly 76.9kHz. While this slightly reduces the effective number of bits (ENOB) from 10 to about 8.5 due to internal noise, it is a necessary tradeoff for waveform visualization.
For deeper architectural details on analog input sampling, refer to the official Arduino analog documentation.
High-Speed Streaming Firmware
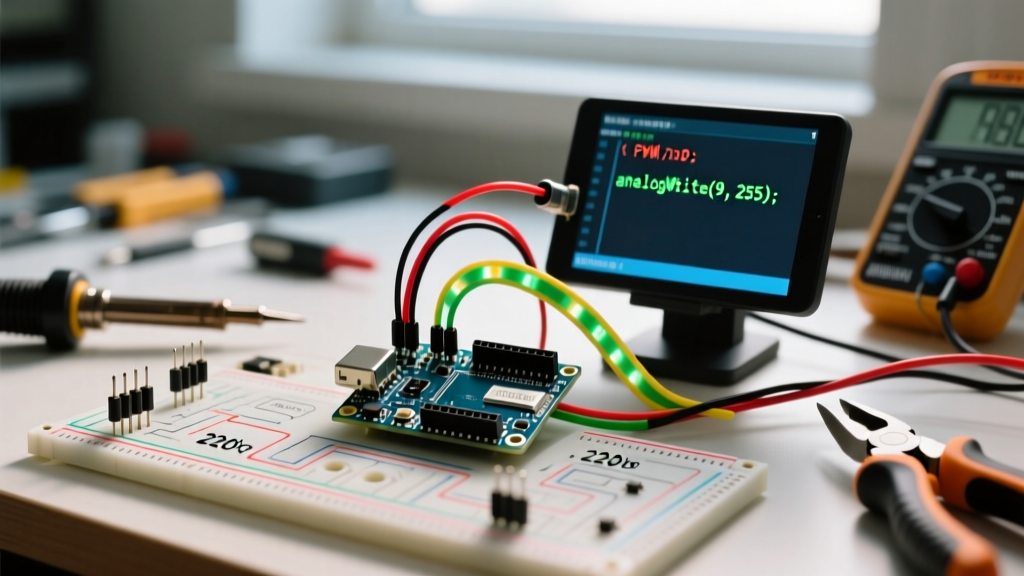
Upload the following optimized sketch to your board. This code bypasses the standard analogRead() overhead and streams raw binary data to the PC at a 250,000 baud rate.
// ADC Prescaler 16 Setup for ~76kHz Sample Rate
void setup() {
  Serial.begin(250000);
  // Clear ADPS bits and set prescaler to 16 (0b100)
  ADCSRA = (ADCSRA & 0b11111000) | 0b100;
  ADMUX = 0x40; // Select ADC0 (Pin A0) with AVcc reference
}

void loop() {
  // Start conversion
  ADCSRA |= (1 << ADSC);
  // Wait for conversion to complete
  while (ADCSRA & (1 << ADSC));
  // Read 10-bit result and send as raw bytes
  uint16_t val = ADC;
  Serial.write(val & 0xFF);
  Serial.write((val >> 8) & 0x03);
}
Step 3: PC Software and Data Visualization
With the hardware protected and the firmware streaming raw bytes at 76.9kHz, you need PC software to reconstruct the waveform. While the built-in Arduino Serial Plotter is excellent for quick checks, it struggles with high-speed binary data streams.
For a true oscilloscope experience, use Python with the pyserial library paired with pyqtgraph. Avoid matplotlib for real-time streaming, as its rendering engine will bottleneck at high data rates, dropping frames and causing the PC software to lag behind the real-time signal.
If you opt for a more powerful MCU like the Teensy 4.1, the Teensy ADC library provides DMA-backed continuous sampling that easily feeds into PC-side FFT analysis tools without blocking the main CPU loop.
Configuring the Serial Buffer
When writing your PC-side Python script, ensure you configure the serial buffer to handle the incoming data rate. A 76.9kHz stream of 2-byte integers equals roughly 153,800 bytes per second. Set your Python serial read chunk size to 2048 bytes and use a rolling window array (like collections.deque) to render the last 1000 samples on your display, mimicking the sweeping trace of a real CRT or LCD oscilloscope.
Edge Cases and Troubleshooting
- Aliasing Artifacts: If your waveform looks like a lower-frequency sine wave but you are measuring a high-frequency square wave, you are experiencing aliasing. The signal frequency exceeds half your sample rate (Nyquist limit). Solution: Add a hardware low-pass RC filter (e.g., 1kΩ resistor and 10nF capacitor) at the probe tip to cut frequencies above 15kHz before they reach the ADC.
- USB Ground Loops: When measuring a circuit powered by a separate bench supply, connecting the Arduino's USB ground to the circuit ground can create a ground loop, introducing 50/60Hz mains hum into your readings. Solution: Ensure both the PC and the Device Under Test (DUT) share a single common ground point, or use a USB galvanic isolator ($15-$20) to break the loop.
- High Source Impedance Errors: The ATmega328P ADC has an internal sample-and-hold capacitor that requires a low-impedance source to charge fully within the conversion window. If your voltage divider uses extremely high resistance values (e.g., 1MΩ and 100kΩ), the ADC will read lower voltages than actual. Keep the Thevenin equivalent resistance of your divider under 10kΩ to ensure accurate charging.
- Baud Rate Mismatches: If the PC software displays garbage data or flatlines, verify that the CH340 or ATmega16U2 USB-serial bridge on your specific board supports 250,000 baud. Some older clone boards with counterfeit CH340 chips fail above 115,200 baud. Drop the firmware to 115200 and adjust the PC software accordingly.
Final Verdict: When to Use a DIY Scope
Building an Arduino PC oscilloscope is a phenomenal educational exercise and a highly practical tool for audio-frequency analysis, I2C/SPI clock debugging, and slow thermal sensor mapping. However, it lacks the hardware triggering, deep memory buffers, and analog bandwidth of a dedicated scope. Use it to augment your workbench, not replace your primary diagnostic equipment.