
The Protocol Engineer's Bottleneck
When developing firmware that relies on hardware communication protocols like I2C, SPI, UART, or CAN bus, the code editor is only half the battle. The true test of an environment is how well it handles protocol debugging, raw hex inspection, and logic analysis integration. As of 2026, with the market dominated by high-speed multi-core microcontrollers like the ESP32-S3 and Raspberry Pi RP2350, pushing 2Mbps over UART or managing multi-device SPI daisy-chains requires more than a basic text editor.
Finding the best Arduino IDE for protocol development means looking beyond simple code compilation. You need an environment that supports raw byte streaming, integrates with external logic analyzers, and provides deep library management for complex protocol stacks like LoRaWAN or Modbus RTU. In this guide, we evaluate the top contenders through the lens of a protocol engineer.
Evaluating the Best Arduino IDE Options for Comms
1. Arduino IDE 2.3.x (The Native Evolution)
The official Arduino IDE has evolved significantly from its legacy 1.8.x roots. Built on Eclipse Theia and powered by the arduino-cli backend, it now features a legitimate integrated debugger and an improved Serial Plotter. However, for strict protocol analysis, it presents a mixed bag.
- The Good: Native integration with CMSIS-DAP and J-Link debuggers allows you to set breakpoints inside the
WireorSPIlibraries, letting you inspect I2C shift registers in real-time. - The Bad: The Serial Monitor lacks native hex-dumping. If you are debugging a raw UART stream from a GPS module (NMEA sentences) or a custom binary protocol, you are forced to write custom
printfwrappers just to view raw bytes. - Edge Case Failure: When debugging high-baud UART (e.g., 2,000,000 baud on an ESP32-S3), the Arduino IDE 2.x Java-based serial buffer occasionally drops packets under heavy OS load, leading to false framing error assumptions.
2. PlatformIO via VS Code (The Protocol Powerhouse)
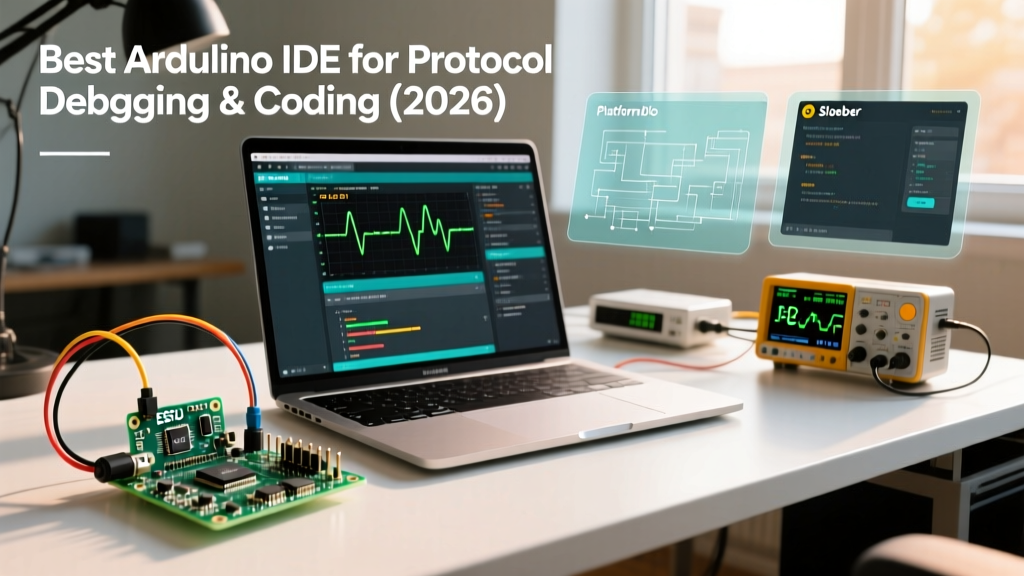
For professional embedded engineers, PlatformIO remains the undisputed heavyweight. By leveraging Visual Studio Code's ecosystem, it transforms into the best Arduino IDE for advanced protocol stack development. Its killer feature for protocol engineers is the monitor_filters configuration.
By adding a simple block to your platformio.ini file, you can instantly decode raw protocol streams without altering your firmware code:
[env:esp32s3]
platform = espressif32
board = esp32-s3-devkitc-1
monitor_speed = 2000000
monitor_filters = hexlify, time, log2file
This configuration forces the serial monitor to display raw hexadecimal bytes alongside timestamps, which is critical when reverse-engineering proprietary UART protocols or verifying SPI MOSI/MISO register writes.
3. Sloeber (The Eclipse Alternative)
Sloeber is an Eclipse-based plugin tailored for Arduino development. While its UI feels dated compared to VS Code, its strength lies in managing massive codebases. If you are writing a custom CAN bus gateway for automotive applications using the MCP2515 controller, Sloeber's robust project management and integrated Git tooling prevent the dependency hell that often plagues complex communication stacks.
Protocol Debugging Feature Matrix
How do these environments stack up when dealing with the realities of hardware communication? The table below breaks down their capabilities based on real-world protocol debugging requirements.
| Feature / Capability | Arduino IDE 2.x | PlatformIO (VS Code) | Sloeber (Eclipse) |
|---|---|---|---|
| Raw Hex UART Viewing | Requires custom code | Native (hexlify filter) |
Requires custom code |
| I2C/SPI Library Debugging | Excellent (Cortex-Debug) | Excellent (Cortex-Debug) | Moderate (GDB integration) |
| Logic Analyzer Integration | Manual (Alt-Tab required) | Seamless (PulseView/Saleae) | Manual |
| CAN Bus Stack Management | Poor (Library conflicts) | Excellent (Strict versioning) | Good |
| Cost | Free | Free (Core) / $99 (Enterprise) | Free |
Deep Dive: Debugging I2C Clock Stretching & Bus Lockups
To understand why the choice of IDE matters, consider one of the most notorious protocol edge cases: I2C Clock Stretching.
When a slave device (like a BME280 environmental sensor or an OLED display) needs extra processing time, it holds the SCL (clock) line LOW. The master (your Arduino) is supposed to wait until SCL goes HIGH before sending the next bit. However, the default AVR Wire library lacks a hardware timeout. If the slave crashes or the bus experiences noise, the SCL line stays low forever, and your microcontroller hangs.
Expert Insight: You cannot debug an I2C bus lockup using only the Arduino IDE's Serial Monitor, because the code execution has halted before it can print an error. You must use an IDE that supports hardware breakpoint debugging (like PlatformIO with a J-Link) or pair it with a logic analyzer to visually confirm the SCL line is being held low for >500µs.
According to the official Arduino IDE documentation, while the IDE 2.x debugger supports ARM Cortex-M architectures (like the RP2350 or SAMD21), it struggles with older AVR chips. PlatformIO offers broader GDB server configurations, making it easier to trap the exact instruction where the I2C peripheral hangs.
Integrating Hardware Logic Analyzers with Your IDE
No software IDE can replace hardware truth. When SPI CPOL/CPHA modes (clock polarity and phase) are misconfigured, the data on the MISO line will look like garbage. To solve this, protocol engineers rely on logic analyzers.
The Saleae Logic software provides industry-standard protocol decoding, but the $499 price tag of the Logic Pro 8 is steep for hobbyists. The 2026 workaround? Use a $15 24MHz 8-channel clone analyzer paired with the open-source PulseView (sigrok) software.
Workflow for the Best Arduino IDE Setup:
- Open PlatformIO in VS Code and flash your SPI peripheral test code.
- Open PulseView side-by-side on a secondary monitor.
- Trigger the logic analyzer capture precisely when your firmware asserts the SPI Chip Select (CS) pin LOW.
- Use PulseView's SPI decoder to verify if the master is sending Mode 0 (CPOL=0, CPHA=0) while the slave expects Mode 3.
As detailed in the PlatformIO VS Code integration guide, you can even configure custom build tasks to automatically launch your logic analyzer software alongside your serial monitor, creating a unified protocol debugging cockpit.
UART Framing Errors and Baud Rate Drift
Another common protocol failure is UART framing errors, often caused by baud rate drift. If your Arduino is running on an external 16MHz crystal, but your USB-to-UART bridge relies on an internal RC oscillator, a 2% drift can cause packet corruption at 115200 baud.
The best Arduino IDE setup for this involves using PlatformIO's monitor_filters = hexlify to spot corrupted bytes (e.g., receiving 0xFE instead of 0xFF), combined with an oscilloscope to measure the actual bit-width of the start bit. If the bit-width is 8.8µs instead of the expected 8.68µs (for 115200 baud), you know you have a hardware clock issue, not a software bug.
Final Verdict: Which is the Best Arduino IDE for You?
If your definition of "best" hinges on rapid prototyping, beginner-friendly UI, and basic I2C/SPI sensor reading, Arduino IDE 2.x is perfectly adequate. Its improved debugger is a massive leap forward for native hardware.
However, if you are engineering robust communication gateways, debugging raw binary UART streams, reverse-engineering proprietary SPI registers, or managing complex CAN bus stacks, PlatformIO via VS Code is unequivocally the best Arduino IDE available in 2026. Its platformio.ini environment filters, strict library versioning, and seamless side-by-side integration with logic analysis tools provide the depth and precision that professional protocol development demands.