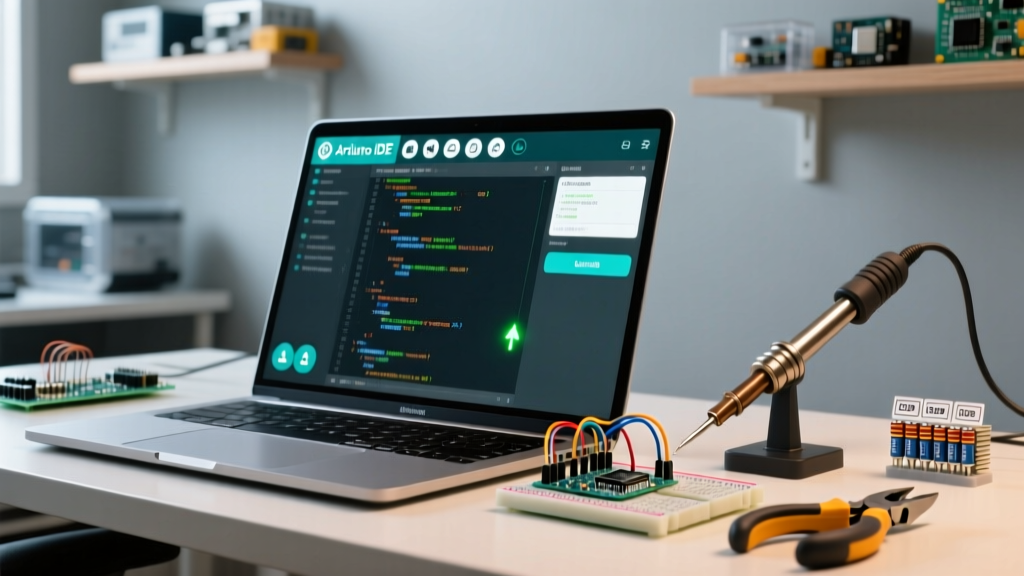

Decoding the Interface: Your First Look
When you double-click the Arduino IDE icon on your desktop to launch the software, you are greeted by an interface that has evolved significantly over the last few years. For beginners transitioning into microcontroller programming in 2026, the modern Arduino IDE (version 2.3.x) is a massive upgrade from the legacy 1.8.x Java-based environment. It is now built on the Eclipse Theia framework, powered by the arduino-cli backend, and features a sleek, dark-mode-native workspace.
However, this modernization means the layout has shifted. Understanding every Arduino IDE icon is crucial for efficient coding, compiling, and troubleshooting. Clicking the wrong button can lead to compilation errors, failed uploads, or hours of frustrating debugging. This guide breaks down every icon in the toolbar, sidebar, and status bar, providing actionable shortcuts and real-world troubleshooting tips for modern boards like the Arduino Uno R4 WiFi ($27) and Nano ESP32 ($21).
The Core Toolbar: Top-Left Action Icons
The top-left cluster contains the most frequently used commands. These are the icons you will interact with every single time you write and deploy code.
| Icon Name | Visual | Shortcut | Function & Pro-Tip |
|---|---|---|---|
| Verify | Checkmark | Ctrl+R / Cmd+R | Compiles your code to check for syntax errors without sending it to the board. Pro-Tip: Always verify before uploading to catch missing semicolons or undeclared variables quickly. |
| Upload | Right Arrow | Ctrl+U / Cmd+U | Compiles and flashes the binary to the microcontroller via the selected COM port. Under the hood, this triggers tools like avrdude or bossac depending on your board. |
| New | Blank Page | Ctrl+N / Cmd+N | Opens a new, blank sketch in a new tab or window. Automatically names the file 'sketch_' followed by the current date. |
| Open | Folder | Ctrl+O / Cmd+O | Opens the Sketchbook menu, allowing you to browse local projects or access the built-in Examples library (e.g., 'Blink' or 'Wire I2C Scanner'). |
| Save | Floppy Disk | Ctrl+S / Cmd+S | Saves the current sketch. If the sketch is unsaved or a temporary example, it will prompt you to create a dedicated folder, which is mandatory for Arduino compilation. |
The Left Sidebar: Navigation & Management Icons
In older versions, these tools were buried in dropdown menus. In the modern IDE, they are pinned to the left sidebar for rapid access. According to Arduino's official user interface documentation, this sidebar is the command center for managing your environment.
1. Board Manager Icon (Circuit Board)
This icon opens the Board Manager, which is used to install or update hardware cores. If you buy a third-party ESP32 or an Arduino Portenta H7, you must use this icon to install the specific compiler toolchain and board definitions. For example, installing the 'Arduino Mbed OS GIGA Boards' core is required before the IDE will recognize the GIGA R1 WiFi.
2. Library Manager Icon (Three Books)
Do not confuse this with the Board Manager. The Library Manager is strictly for adding pre-written C++ code modules (like FastLED or Adafruit_NeoPixel). Beginner Mistake: Searching for 'ESP32' in the Library Manager instead of the Board Manager. Remember: Boards = Hardware/Cores; Libraries = Code functions.
3. Search Icon (Magnifying Glass)
This allows you to search across all open files, installed libraries, and even the Arduino reference documentation without leaving the IDE. Use Regular Expressions (Regex) by clicking the '.*' toggle in the search bar to find complex variable patterns.
4. The Debugger Icon (The Bug)
This is the most significant addition for modern beginners. As detailed in the Arduino IDE v2 Debugger guide, this icon allows you to set breakpoints, step through code line-by-line, and inspect live memory variables. Crucial Caveat: The debugger icon will only activate if you are using a board with a built-in hardware debug probe (like the Arduino Nano ESP32 or Uno R4 WiFi) or an external CMSIS-DAP probe. If you are using a classic Arduino Uno R3, this icon will remain greyed out, and you must rely on Serial.print() debugging.
The Top-Right: Serial & Output Icons
Located near the top right of the main window, these icons control how your microcontroller communicates back to your computer.
- Serial Monitor (Magnifying Glass with Lines): Opens a text-based console to read
Serial.println()data. Ensure your baud rate dropdown (usually bottom right of the panel) matches your code'sSerial.begin(9600)rate, or you will see garbled text. - Serial Plotter (Graph Icon): Translates comma-separated serial data into a live, real-time line graph. This is invaluable for tuning PID controllers or visualizing analog sensor noise without writing external Python scripts.
The Bottom Status Bar: Connection Icons
The bottom bar is your connection dashboard. It features two critical dropdowns:
- Board Selector: Displays the currently selected microcontroller. Clicking it opens a matrix where you can pin your most-used boards.
- Port Selector: Displays the active COM port (Windows) or
/dev/cu.usbmodem(macOS). If this is blank, your OS does not detect the board. Try a different USB cable—specifically, ensure it is a data-sync cable, not a charge-only cable.
Troubleshooting: Greyed-Out or Missing Icons
Beginners frequently encounter UI states that seem broken. Here is how to fix the most common icon-related issues:
Issue: The Upload (Right Arrow) icon is greyed out and unclickable.
Diagnosis: The IDE does not know where to send the compiled binary. You have not selected a target board or a valid COM port in the bottom status bar. Click the Board Selector, choose your hardware, and assign the port.
Issue: The Serial Monitor icon is missing from the top right.
Diagnosis: In IDE 2.x, if the Serial Monitor is already open and docked in the bottom panel, the top-right icon may hide to prevent duplicate instances. Look at the bottom panel tabs (Output, Serial Monitor, Serial Plotter) and click the 'Serial Monitor' tab directly.
Issue: The Debugger (Bug) icon is greyed out despite having an Uno R4.
Diagnosis: The debugger requires the board to be connected via a port that supports debugging. On some operating systems, you may need to install specific udev rules (Linux) or Zadig drivers (Windows) to expose the CMSIS-DAP debug interface alongside the standard serial COM port.
Under the Hood: What Happens When You Click an Icon?
Understanding the backend architecture of the Arduino IDE open-source GitHub repository helps demystify the icons. When you click the Verify icon, the IDE's frontend sends a command to the arduino-cli daemon. The daemon then invokes the GCC compiler (avr-gcc or arm-none-eabi-gcc) to translate your C++ sketch into machine code (.hex or .bin).
When you click the Upload icon, the IDE initiates a secondary process. For an AVR-based board, it triggers avrdude to toggle the DTR line, resetting the microcontroller into its bootloader, and then streams the hex file over UART. For an ESP32, it invokes esptool.py to handle the complex SPI flash memory writing sequence. Knowing this helps you read the black 'Output' console at the bottom of the screen when an upload fails, allowing you to spot exactly which underlying tool threw the error.
Summary: Mastering the Workspace
Memorizing the function of each Arduino IDE icon transforms you from a passive user into an active developer. Rely on keyboard shortcuts (Ctrl+R to Verify, Ctrl+U to Upload, Ctrl+Shift+M for Serial Monitor) to keep your hands on the keyboard, and use the visual icons as a reliable status dashboard for your hardware connections and debugging sessions.