
The Reality of Arduino Debugging in Modern Workflows
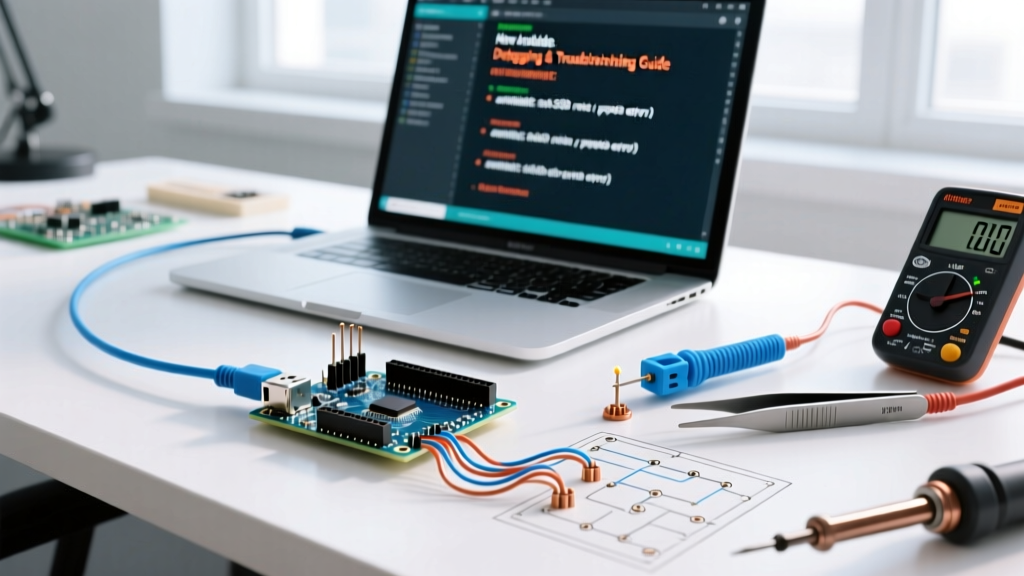
Learning how to program Arduino microcontrollers is a rite of passage for electrical engineers and DIY enthusiasts. However, the journey from writing your first blink sketch to deploying complex I2C sensor networks is paved with cryptic compilation errors, silent memory leaks, and stubborn upload failures. As of 2026, the ecosystem has matured significantly. The shift to Arduino IDE 2.3.x has introduced native GDB-based hardware debugging for boards like the Nano ESP32 and Portenta H7, fundamentally changing how we troubleshoot embedded code.
This guide bypasses the basic "check your USB cable" advice and dives deep into the actual failure modes, memory constraints, and toolchain quirks you will encounter when programming modern Arduino architectures.
Deconstructing Compilation Errors: Beyond the Red Text
When you hit the verify button, the Arduino IDE invokes the gcc-avr or xtensa-esp32-elf-gcc compiler. The resulting wall of orange and red text often obscures the root cause. The golden rule of C++ compilation errors is to always read the very first error; subsequent errors are frequently cascading hallucinations caused by the compiler losing its syntactic bearings.
The "Expected ';' Before '}' Token" Illusion
This is the most common syntax error. While it literally means you missed a semicolon, the actual missing character is often on the line above the one the compiler flags. If you declare a macro or a multi-line #define statement and forget a backslash \ or semicolon, the compiler won't realize the statement is broken until it hits the closing brace of your function.
Library Namespace Collisions
As your project grows, you will inevitably face library conflicts. For example, if you include both Adafruit_NeoPixel.h and FastLED.h in an ESP32-S3 project, you may encounter hardware timer conflicts or duplicate definition errors for low-level RMT (Remote Control) peripherals.
Pro-Tip: Use the #pragma message("Compiling Module A") directive in your headers to trace exactly which libraries and modules the preprocessor is pulling into your build chain.
Upload Failures and Bootloader Edge Cases
Writing the code is only half the battle; getting it onto the silicon is where many developers stall. The dreaded avrdude: stk500_recv(): programmer is not responding error can stem from multiple hardware and software layers.
The CH340 vs. ATmega16U2 Driver Divide
Genuine Arduino Uno R3 and R4 boards use the ATmega16U2 (or an integrated Renesas USB peripheral on the R4) for USB-to-Serial conversion. Clone boards frequently use the WCH CH340G chip. On Windows 11, unsigned or outdated CH340 drivers will silently fail to bind to the COM port, resulting in a "Board at COM3 is not available" error. Always download the latest signed WHQL drivers directly from the WCH repository rather than relying on third-party driver packs.
ESP32 Boot Mode Strapping Pins
When programming the Arduino Nano ESP32 or generic ESP32-DevKitC boards, the chip must be forced into UART download mode. If your sketch utilizes GPIO0, GPIO2, or GPIO12 for sensors or I2C, external pull-up/pull-down resistors can interfere with the boot strapping pins.
- Symptom: The IDE hangs at "Connecting..." and eventually times out.
- Fix: Ensure GPIO0 is pulled LOW during the exact millisecond the EN (Reset) pin is released HIGH. On custom PCBs, add a 10kΩ pull-up to GPIO0 and a 100nF capacitor on the EN line to give the serial DTR/RTS circuit time to trigger the bootloader.
SRAM Exhaustion: The Silent Killer
When figuring out how to program Arduino boards with limited memory, understanding the SRAM layout is critical. The classic ATmega328P (Uno R3) has a mere 2KB of SRAM. The ESP32-S3 has 512KB. Running out of memory on an AVR doesn't yield a compilation error; it results in unpredictable runtime reboots.
Heap and Stack Collisions
In AVR architecture, the stack grows downward from the top of SRAM, while the heap (used by malloc() and the String class) grows upward. If they collide, your microcontroller will hard fault. Avoid the Arduino String object entirely in production firmware. It causes severe heap fragmentation. Instead, use fixed-length character arrays (char buffer[64];) and snprintf().
Reclaiming Flash Memory with the F() Macro
String literals in your Serial.println("Sensor reading:"); statements are copied into SRAM at runtime by default. Wrap them in the F() macro to force the compiler to leave them in Flash memory (PROGMEM), reading them byte-by-byte directly from the instruction space.
// Bad: Wastes 15 bytes of precious SRAM
Serial.println("System Initialized");

// Good: Leaves the string in Flash memory
Serial.println(F("System Initialized"));
For a deeper dive into AVR memory constraints, consult the AVR Libc Memory FAQ, which remains the definitive guide to heap and stack management on 8-bit microcontrollers.
Hardware Debugging: Moving Beyond Serial.println()
For decades, the standard debugging method was scattering Serial.println() throughout the code. This alters execution timing and can mask race conditions in interrupt service routines (ISRs). With the release of Arduino IDE 2.x, native hardware debugging is now accessible without external JTAG probes, provided you use supported boards.
Setting Up the IDE 2.3 Debugger
Boards like the Arduino Nano ESP32 feature an onboard USB-C JTAG interface. To use the debugger:
- Select your board and port in the IDE.
- Click the "Debug" icon (the bug symbol) in the left toolbar instead of the standard Upload arrow.
- The IDE will compile with
-O0 -g3flags (disabling optimization and including full debug symbols) and launch the GDB server.
Common Error Matrix and Solutions
Keep this troubleshooting matrix handy when the IDE throws obscure errors.
| Error String | Root Cause | Actionable Fix |
|---|---|---|
avrdude: stk500_recv() |
Bootloader communication failure or wrong COM port. | Check CH340 drivers, press hardware reset exactly as upload begins, or burn a fresh bootloader via ISP. |
exit status 1 / Error compiling |
Generic catch-all for syntax or library scope issues. | Enable "Show verbose output during compilation" in Preferences to see the exact gcc flag that failed. |
Sketch too big |
Flash memory (32KB on Uno) exceeded. | Use the F() macro, strip unused libraries, or change compiler optimization to "Smallest (-Os)" in board settings. |
Board at [port] is not available |
OS-level USB permission denial or port lock. | On macOS/Linux, add your user to the dialout group. On Windows, check Device Manager for hidden COM port conflicts. |
Multiple libraries found for... |
Conflicting versions of the same library installed. | Open Library Manager, search the conflicting library, and uninstall older/duplicate versions. |
Advanced Serial Telemetry and Hex Dumping
When debugging communication protocols like SPI or I2C, standard text output is insufficient. You need to see the raw bytes. When programming the ESP32 family, utilize Serial.printf() for formatted hex dumps, which is vastly superior to standard print functions for binary data inspection.
void printHexDump(uint8_t *buffer, size_t len) {
  for (size_t i = 0; i < len; i++) {
    Serial.printf("%02X ", buffer[i]);
    if ((i + 1) % 16 == 0) Serial.println();
  }
  Serial.println();
}
Furthermore, leverage the Arduino Serial Plotter (Tools > Serial Plotter). By outputting comma-separated values (e.g., Serial.print(sensor1); Serial.print(","); Serial.println(sensor2);), you can visualize sensor noise, PID loop oscillations, and I2C latency spikes in real-time without writing external Python scripts.
Final Thoughts on Firmware Resilience
Mastering how to program Arduino hardware is less about memorizing syntax and more about understanding the underlying resource constraints and toolchain behaviors. By abandoning dynamic memory allocation on 8-bit boards, utilizing hardware breakpoints on 32-bit architectures, and systematically isolating bootloader strapping issues, you transition from a hobbyist guessing at errors to an embedded engineer deploying resilient firmware. For ongoing community support and edge-case troubleshooting, the Arduino Support Troubleshooting Hub remains an invaluable resource for diagnosing obscure hardware-level faults.