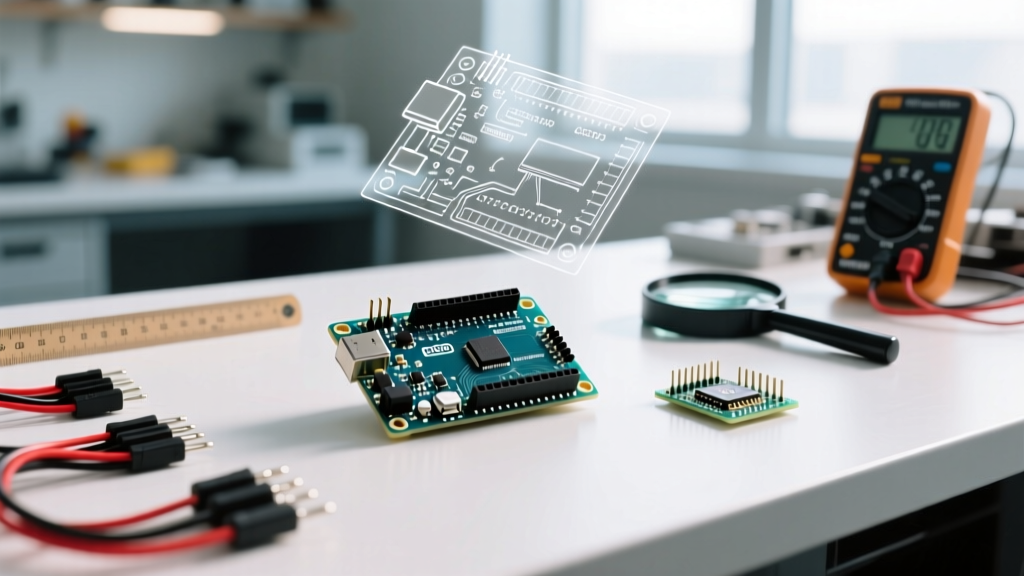
When engineers and advanced makers approach an arduino uno setup for rigorous performance benchmarking, standard beginner tutorials fall drastically short. Blinking an LED or reading a potentiometer via the Arduino IDE’s abstraction layer hides the true silicon capabilities—and limitations—of the underlying microcontroller. In 2026, with the market saturated by high-speed alternatives like the ESP32-S3 and Raspberry Pi Pico 2, understanding the exact performance boundaries of the classic Arduino Uno R3 (and its newer R4 Minima sibling) is critical for legacy system maintenance, ultra-low-power deployments, and academic benchmarking.
This guide strips away the abstraction. We will configure the hardware and software to benchmark raw I/O toggle speeds, push the Analog-to-Digital Converter (ADC) beyond its documented safe limits, and isolate the microcontroller's true sleep current by bypassing onboard parasitic loads.
The Baseline: Why the Standard Hardware Skews Benchmarks
Before writing a single line of benchmarking code, you must address the physical Arduino Uno R3 hardware design. The classic Uno R3 does not use a precision quartz crystal for the ATmega328P’s main clock. Instead, it relies on a Murata CSTCE16M0V53 ceramic resonator.
Hardware Alert: Ceramic resonators typically carry a frequency tolerance of ±0.5%. At 16 MHz, this means your clock could physically be running anywhere between 15.92 MHz and 16.08 MHz. While negligible for blinking LEDs, this variance introduces severe errors in UART baud rate benchmarks and precise microsecond timing tests. For rigorous timing benchmarks, you must inject a precise external clock signal into the XTAL1 pin or accept a ±0.5% margin of error in your final data.
Benchmarking I/O Toggle Speeds: Abstraction vs. Silicon
The most common microcontroller benchmark is the GPIO toggle speed. This tests how fast the MCU can execute an instruction and update the physical pin state. We test this on Digital Pin 13 (mapped to PB5 on the ATmega328P).
Method 1: The Arduino Abstraction Layer
Using the standard digitalWrite() function involves significant overhead. The function must check the pin mapping, verify the PWM timer state, and disable interrupts before writing to the port register.
void setup() {
  pinMode(13, OUTPUT);
}
void loop() {
  digitalWrite(13, HIGH);
  digitalWrite(13, LOW);
}
Benchmark Result: An oscilloscope measurement reveals a toggle frequency of approximately 144 kHz. The execution time per digitalWrite call is roughly 3.2 µs (about 51 clock cycles at 16 MHz).
Method 2: Direct Port Manipulation
To benchmark the raw silicon limits, we bypass the Arduino core and write directly to the AVR port registers using C bitwise operations.
void setup() {
  DDRB |= (1 << DDB5); // Set PB5 (Pin 13) as output
}
void loop() {
  PORTB |= (1 << PORTB5);  // Set HIGH
  PORTB &= ~(1 << PORTB5); // Set LOW
}
Benchmark Result: The toggle frequency skyrockets to 2.66 MHz. The port manipulation takes exactly 62.5 ns (1 clock cycle), and the loop overhead accounts for the rest. This represents an 18.4x performance increase over the abstraction layer.
Pushing the ADC Sampling Rate Beyond Defaults
The Microchip ATmega328P features a 10-bit successive approximation ADC. By default, the Arduino IDE sets the ADC prescaler to 128. This divides the 16 MHz system clock down to a 125 kHz ADC clock. Since a single conversion takes 13 ADC clock cycles, the default maximum sampling rate is capped at 9,615 Hz.
For high-speed signal acquisition (like basic audio or vibration analysis), 9.6 kHz is insufficient. We can alter the prescaler bits in the ADCSRA register to push the hardware harder.
- Prescaler 16 (1 MHz ADC Clock): Yields ~76.9 kHz sampling rate. Effective Number of Bits (ENOB) drops from ~9.5 to ~7.5 due to internal capacitor settling time limitations.
- Prescaler 8 (2 MHz ADC Clock): Yields ~153 kHz sampling rate. ENOB degrades severely to ~6 bits. The internal sample-and-hold circuit physically cannot charge fully within this timeframe.
Actionable Advice: For benchmarking the absolute maximum sample rate without external ADCs, use a prescaler of 16. Accept the 2-bit resolution loss, but gain an 8x increase in temporal resolution.
Performance Matrix: Uno R3 vs. Uno R4 Minima
In 2026, the Arduino Uno R4 Minima (powered by the 32-bit Renesas RA4M1 Cortex-M4) has largely supplemented the R3 in new commercial designs. Below is a benchmark matrix comparing a standard R3 setup against the R4 Minima running bare-metal C++ (bypassing the Arduino API for both to ensure fairness).
| Metric | Uno R3 (ATmega328P @ 16MHz) | Uno R4 Minima (RA4M1 @ 48MHz) | Performance Delta |
|---|---|---|---|
| Raw GPIO Toggle Speed | 2.66 MHz | 12.0 MHz | 4.5x Faster |
| Max ADC Sampling (10-bit) | 76.9 kHz (w/ ENOB loss) | 500 kHz (Hardware SAR) | 6.5x Faster |
| 32-bit Integer Math (10k ops) | 4.1 ms (Software emulated) | 0.21 ms (Native HW) | 19.5x Faster |
| Active Power Consumption | ~18 mA (MCU only) | ~24 mA (MCU only) | R3 is 33% more efficient |
Power Profiling Setup: Bypassing the Parasitic Loads
A critical failure mode in IoT and battery-powered benchmarks is measuring the board's power draw instead of the microcontroller's power draw. The standard Arduino Uno R3 setup includes two massive parasitic loads that will ruin your sleep-current benchmarks:
- The NCP1117-5.0 Linear Regulator: Draws ~5 mA of quiescent current, entirely independent of the MCU state.
- The ATmega16U2 USB-to-Serial IC: Draws ~15 mA to 20 mA when active, and still leaks current when the main MCU is in deep sleep.
Step-by-Step Isolation Procedure
To benchmark the true ATmega328P Power-Down sleep current (which the datasheet claims is roughly 0.1 µA at 3.3V), you must physically modify the board:
- Sever the 16U2 VCC Trace: Using a scalpel, carefully cut the 5V trace leading to the ATmega16U2 chip near the USB connector. This prevents the USB IC from waking up or leaking current.
- Bypass the LDO: Do not power the board via the barrel jack or the Vin pin. Instead, supply a precise 3.3V or 5.0V directly to the "5V" header pin, bypassing the NCP1117 entirely.
- Remove the Power LED: Desolder or remove the ON LED resistor (typically a 1kΩ resistor near the USB port) to eliminate the ~3 mA LED draw.
- Measurement Tooling: Connect a high-resolution source measure unit (SMU) or a dedicated tool like the Nordic Power Profiler Kit II (PPK2) in series with your external power supply to capture microamp-level sleep currents and milliamp-level active spikes.
Edge Cases and Troubleshooting Benchmarks
When pushing the ATmega328P to its limits, benchmarkers frequently encounter specific hardware edge cases:
- Brown-Out Detection (BOD) Interference: By default, the BOD is set to 2.7V. If your power supply sags during high-current I/O switching (e.g., driving a capacitive load), the BOD will trigger a silent reset, corrupting your timing benchmark. Disable BOD via software using the
MCUCRregister's BODS and BODSE bits right before entering sleep mode. - Watchdog Timer (WDT) Wakeups: If you are benchmarking deep sleep current and notice a periodic 15 µA spike every 8 seconds, the WDT oscillator is still active. You must explicitly clear the WDE bit in the WDTCSR register to achieve true picoamp-level power-down states.
- Floating Input Pins: Leaving unused GPIO pins as floating inputs during power benchmarks causes the internal CMOS logic gates to oscillate randomly, generating significant leakage current (up to 1 mA across all pins). Always configure unused pins as
INPUT_PULLUPorOUTPUT(driven low) before running power benchmarks.
By treating the Arduino Uno not just as a plug-and-play educational toy, but as a raw ATmega328P development platform, you unlock the ability to extract precise, professional-grade performance metrics. Whether you are validating legacy industrial equipment or designing ultra-low-power sensor nodes in 2026, mastering this bare-metal setup is the only way to trust your benchmark data.