
Introduction: Beyond the Serial Monitor
When debugging a simple LED blink, the Arduino IDE Serial Monitor is perfectly adequate. However, the moment you need to tune a PID controller, analyze the noise floor of an analog sensor, or visualize the 50Hz sine wave output of an MPU6050 accelerometer, scrolling through endless columns of text becomes impossible. This is where the serial plot Arduino IDE feature becomes an indispensable part of your maker toolkit.
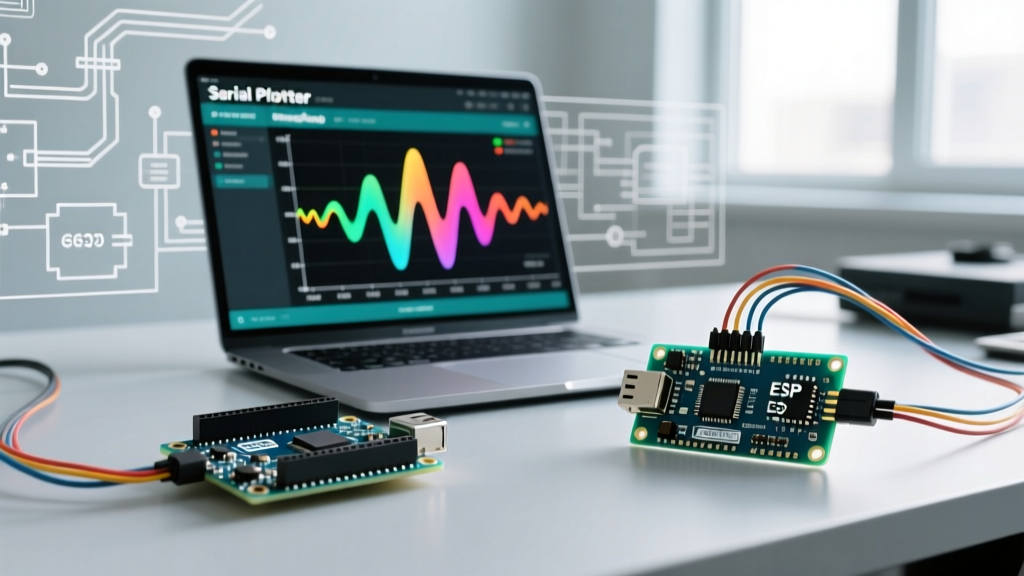
Introduced in earlier IDE versions and massively overhauled in Arduino IDE 2.3.x, the Serial Plotter translates raw serial data into real-time, color-coded line graphs. In this comprehensive 2026 guide, we will cover the exact syntax requirements, hardware-specific baud rate optimizations, and advanced troubleshooting techniques to master live data visualization on microcontrollers ranging from the classic ATmega328P to the dual-core ESP32-S3.
The Golden Rule of Serial Plotter Syntax
The most common reason makers abandon the plotter is a fundamental misunderstanding of its parsing engine. Unlike the Serial Monitor, which renders any ASCII character, the Serial Plotter strictly expects numerical data separated by delimiters, terminated by a newline character.
Single vs. Multi-Variable Plotting
To plot a single variable, you simply print the number followed by a newline. To plot multiple variables simultaneously (which the IDE will automatically assign distinct colors), you must separate them with a comma or a tab, and terminate the final variable with a newline.
- Correct Single Variable:
Serial.println(sensorValue); - Correct Multi-Variable:
Serial.print(temp); Serial.print(","); Serial.println(humidity); - Incorrect (Breaks Plotter):
Serial.print("Temp: "); Serial.println(temp);
Expert Insight: Never include text labels like "X:" or "Sensor 1" in your serial output when using the plotter. The parsing engine will attempt to cast the string to a float, fail, and either drop the data point or cause the Y-axis auto-scaling to glitch violently. Rely on the IDE 2.x legend feature to identify your variables based on the order they are printed.
Step-by-Step Tutorial: Plotting BME280 Environmental Data
Let us apply the serial plot Arduino workflow to a real-world scenario: visualizing temperature and humidity from a Bosch BME280 sensor. This is particularly useful for observing thermal lag or HVAC system responses in real-time.
1. The Code Implementation
Assuming you have the Adafruit BME280 library installed, your loop() function should be stripped of all conversational text. Focus purely on data extraction and formatted transmission:
#include <Wire.h>
#include <Adafruit_BME280.h>

Adafruit_BME280 bme;

void setup() {
  Serial.begin(115200);
  bme.begin(0x76);
}

void loop() {
  float temp = bme.readTemperature();
  float hum = bme.readHumidity();

  // Strict formatting for the Serial Plotter
  Serial.print(temp);
  Serial.print(",");
  Serial.println(hum); // println provides the required \r\n

  delay(50); // 20Hz sampling rate
}
2. Configuring the IDE Plotter
Upload the sketch, then navigate to Tools > Serial Plotter (or use the shortcut Ctrl+Shift+L). Ensure the baud rate dropdown in the top right corner exactly matches your Serial.begin() declaration (115200 in this case). You will immediately see two distinct lines tracking the environmental changes. Use the mouse wheel to zoom in on the X-axis (time) to inspect micro-fluctuations.
Hardware-Specific Baud Rate Optimization
A frequent bottleneck in high-speed data logging (e.g., plotting raw ADC readings at 1kHz+) is the serial buffer overflowing, which causes the microcontroller to halt execution while waiting for the TX buffer to clear. The maximum reliable baud rate depends entirely on your board's USB-to-Serial architecture.
| Microcontroller Board | USB Architecture | Max Reliable Baud Rate | Plotter Performance Notes |
|---|---|---|---|
| Arduino Uno R3 (ATmega328P) | Hardware UART via ATmega16U2 | 115,200 bps | Prone to buffer blocking above 500Hz sampling. Use 115200 for safety. |
| Arduino Uno R4 Minima (RA4M1) | Native USB CDC | 2,000,000 bps | Excellent for high-speed ADC plotting. Baud rate is technically ignored by native USB, but must match IDE. |
| ESP32-S3 DevKitC-1 | Native USB CDC / UART0 | 921,600 bps (UART) / Native | When using native USB pins (19/20), baud rate is virtual. Ideal for dual-core sensor fusion plotting. |
| Teensy 4.1 (i.MX RT1062) | Native USB 480Mbps | Virtual (Any value) | Can stream megabytes per second. IDE plotter may lag; consider third-party tools for >10kHz. |
For deeper understanding of serial communication limits, refer to the official Arduino Serial.println() Reference.
Advanced Troubleshooting & Edge Cases
Even experienced engineers encounter edge cases when pushing the serial plot Arduino tool to its limits. Here is how to resolve the most common anomalies.
The "Flatline" or "Stuck at Zero" Bug
If your plotter opens but the line remains flat at zero, or the graph refuses to scroll, you are almost certainly missing the newline character. The plotter buffers incoming bytes until it detects a Carriage Return (\r) or Line Feed (\n). If you use Serial.print(value) without a subsequent Serial.println(), the buffer will eventually overflow and dump a massive concatenated number (e.g., "102310241022"), which the plotter reads as a single, massive Y-axis spike, destroying your scale.
High-Frequency Aliasing and UI Lag
The Arduino IDE 2.x Serial Plotter is built on a web-based backend. If you stream data at 10,000Hz, the JavaScript rendering engine will drop frames, resulting in visual aliasing that looks like sensor noise but is actually a software artifact. Solution: Implement a decimation algorithm in your C++ code. Only send every 10th or 100th sample to the serial port, or calculate a moving average before transmission to preserve the visual integrity of the waveform.
Exporting Plot Data to CSV (The Missing Feature)
As of 2026, the native Arduino IDE Serial Plotter still lacks a built-in "Export to CSV" button. If you need to save your plotted data for a MATLAB analysis or a project report, you must bypass the IDE's plotter and capture the raw serial stream.
The Python PySerial Workaround
The most robust method is to use a simple Python script running in the background to log the exact comma-separated values you are generating for the plotter.
import serial
import csv
import time

# Configure to match your Arduino setup
ser = serial.Serial('COM3', 115200, timeout=1)
time.sleep(2) # Wait for Arduino reset

with open('sensor_data.csv', 'w', newline='') as f:
    writer = csv.writer(f)
    writer.writerow(["Temperature", "Humidity"])

    try:
        while True:
            line = ser.readline().decode('utf-8').strip()
            if line:
                writer.writerow(line.split(','))
    except KeyboardInterrupt:
        print("Logging stopped.")
This guarantees you capture every single data point without the UI overhead of the IDE plotter. For more on IDE tools and workflows, consult the Arduino IDE v2 Serial Plotter Documentation.
Frequently Asked Questions
Can I plot negative numbers or floating-point values?
Yes. The Serial Plotter natively supports negative integers, floats, and scientific notation. The Y-axis will automatically scale to accommodate negative excursions, making it perfect for plotting AC waveforms or gyroscopic bidirectional data.
Why does my plotter disconnect randomly on the ESP32?
ESP32 boards often trigger the hardware watchdog timer if the loop() function is blocked by a full serial TX buffer. If the IDE plotter is closed but the Arduino is still trying to send data via native USB CDC, the ESP32 may panic and reboot. Always ensure your serial output routines have timeout safeguards or check Serial.availableForWrite() before transmitting bulk data.
Is there a better alternative for high-speed plotting?
For sampling rates exceeding 5kHz, the native IDE plotter becomes sluggish. We recommend exporting your data via the Python script mentioned above, or utilizing dedicated third-party desktop applications like SerialPlot or CoolTerm, which are optimized for high-throughput binary and ASCII data rendering.