Why Move Beyond Serial.print() for Arduino Debugging?
For years, the standard debugging method in the Arduino ecosystem has been sprinkling Serial.println() statements throughout a sketch. While this works for basic logic verification, it fundamentally alters program timing, consumes precious RAM, and fails completely when tracking down hard faults, memory leaks, or Real-Time Operating System (RTOS) thread deadlocks. To achieve true hardware-level visibility, you need to leverage Arduino OpenOCD (Open On-Chip Debugger) paired with a dedicated debug probe.
OpenOCD acts as the critical bridge between your host computer and the target microcontroller's JTAG or Serial Wire Debug (SWD) interface. By integrating OpenOCD with modern development environments, you gain the ability to set hardware breakpoints, inspect CPU registers in real-time, and step through assembly or C++ code line-by-line without altering the execution timing of your firmware. As of 2026, the combination of VS Code, PlatformIO, and OpenOCD remains the undisputed industry standard for professional and advanced maker embedded development, effectively deprecating older, clunky Eclipse-based debugging plugins.
Required Hardware Stack for Arduino OpenOCD
Before configuring the software, you must select a compatible debug probe. OpenOCD supports a vast array of hardware, but for Arduino-compatible boards (like the SAMD21-based Arduino Zero, STM32 'Blue Pill', or ESP32 via Arduino framework), SWD-capable probes are the most cost-effective and reliable.
| Debug Probe | Approx. Cost (2026) | Target Compatibility | Best Use Case |
|---|---|---|---|
| ST-Link V2 (Clone) | $4 - $8 | STM32, SAMD21, NRF52 | Budget makers, hobbyist STM32/Arduino Zero projects |
| Segger J-Link EDU Mini | $60 - $75 | ARM Cortex-M, RISC-V | University students, advanced RTOS debugging |
| Raspberry Pi Pico (Picoprobe) | $4 | RP2040, generic SWD | RP2040 Arduino core debugging, multi-target setups |
| DAPLink (CMSIS-DAP) | $10 - $15 | Broad ARM Cortex support | Open-source hardware enthusiasts |
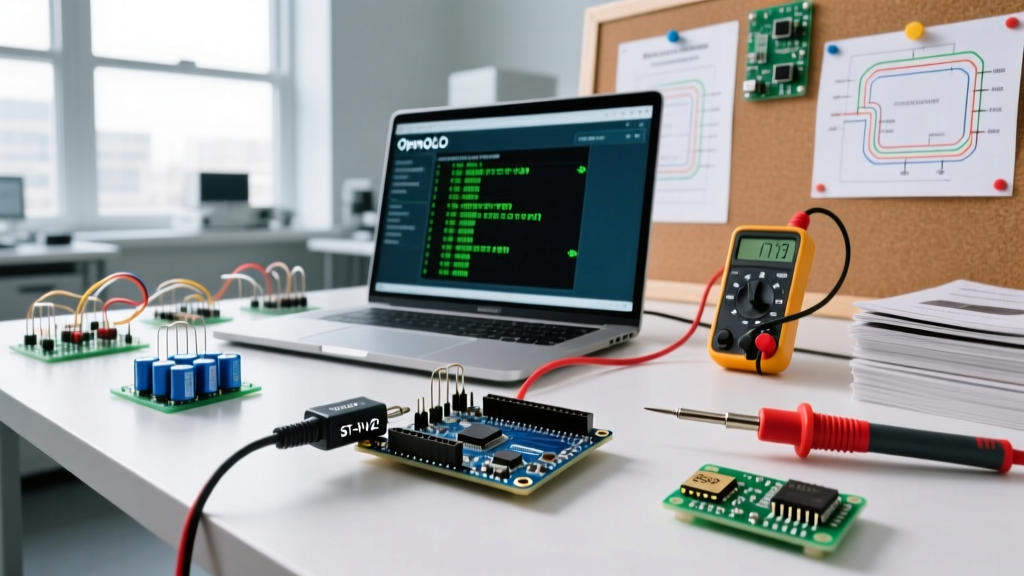
For this tutorial, we will focus on the ST-Link V2, as it offers the best balance of affordability and broad compatibility with the Arduino SAMD and STM32 cores. You can reference the OpenOCD official documentation for a complete matrix of supported interfaces.
Step 1: Wiring the SWD Interface to Your Target
Unlike standard UART uploading, hardware debugging requires a direct connection to the microcontroller's SWD pins. You only need four wires to establish a stable debugging session:
- SWDIO (Serial Wire Data I/O): Bidirectional data line.
- SWCLK (Serial Wire Clock): Clock signal generated by the probe.
- GND (Ground): Common ground reference (crucial for signal integrity).
- 3.3V (Optional but recommended): Powers the target if not powered via USB, and provides the reference voltage for the ST-Link logic level shifters.
Pinout Mapping for Common Arduino- Compatible Boards
Locating the SWD pins can be tricky, as they are often tucked away on the bottom of the PCB or broken out to unpopulated ICSP headers.
- Arduino Zero / SAMD21: Use the 6-pin ICSP header. Pin 1 is MISO (SWDIO), Pin 4 is SCK (SWCLK). Ensure you are using the 3.3V logic pins.
- STM32F103C8T6 (Blue Pill): The SWD pins are clearly labeled on the 4-pin header opposite the USB port:
3.3V,SWCLK,GND,SWDIO. - Generic ESP32 Dev Boards: Note that standard ESP32 (Xtensa architecture) uses JTAG, not SWD. You will need an ESP-Prog or FT2232H-based probe wired to the specific JTAG GPIOs (GPIO 12-15) for OpenOCD to attach correctly.
Step 2: Configuring PlatformIO for Arduino OpenOCD
While the legacy Arduino IDE has limited debugging capabilities, PlatformIO natively wraps OpenOCD, managing the complex GDB server configurations automatically. According to the PlatformIO debugging documentation, integrating OpenOCD requires only a few specific flags in your platformio.ini file.
Open your platformio.ini and apply the following configuration for an Arduino Zero (SAMD21) using an ST-Link:
[env:zeroUSB]
platform = atmelsam
board = zeroUSB
framework = arduino

; OpenOCD Debugging Configuration
debug_tool = stlink
upload_protocol = stlink
build_type = debug

; Halt at the setup() function instead of main()
debug_init_break = tbreak setup
Understanding the Configuration Flags
debug_tool = stlink: Tells PlatformIO to launch OpenOCD using the ST-Link interface scripts.build_type = debug: Compiles the Arduino sketch with-Og -g3 -ggdbflags. This disables aggressive compiler optimizations that reorder code, ensuring your breakpoints map accurately to your C++ source lines.debug_init_break = tbreak setup: By default, GDB halts at the hiddenmain()function inside the Arduino core. This temporary breakpoint forces the debugger to halt exactly when yoursetup()function begins, saving you from stepping through hundreds of lines of hardware initialization code.
Step 3: Launching the GDB Server and Debug Session
With your hardware wired and platformio.ini configured, follow these steps to initiate the Arduino OpenOCD session:
- Connect the ST-Link to your PC via USB, and ensure the target board is powered.
- Open your project in VS Code with the PlatformIO extension installed.
- Click the Debug icon (the play button with a bug) in the bottom status bar, or press
F5. - PlatformIO will automatically compile the sketch in debug mode, launch the OpenOCD GDB server in the background, and attach the ARM GDB client.
Once attached, the VS Code interface will transform. You will see the Variables pane, Watch pane, Call Stack, and Breakpoints panel. Click in the gutter next to a line of code in your loop() function to set a red breakpoint, and press the 'Continue' (Play) button in the floating debug toolbar. The CPU will instantly halt at that exact instruction, allowing you to inspect memory addresses and peripheral registers.
Troubleshooting Common OpenOCD Connection Failures
Hardware debugging introduces physical layer variables that standard USB uploading avoids. Here are the most common OpenOCD errors and their exact solutions.
Error: libusb_open() failed with LIBUSB_ERROR_ACCESS
This is the most frequent error on Linux distributions (Ubuntu, Debian, Fedora). It means your user account lacks the permissions to access the USB device node of the ST-Link.
The Fix: You must install OpenOCD udev rules. You can find the official rules in the OpenOCD GitHub repository. Create a new file and reload the rules:
sudo nano /etc/udev/rules.d/99-openocd.rules
# Paste the udev rules, save, and run:
sudo udevadm control --reload-rules
sudo udevadm trigger
Unplug and replug the ST-Link after executing these commands.
Warn : UNEXPECTED idcode: 0x00000000
This indicates that OpenOCD is communicating over the SWD wires, but the target microcontroller is not responding with its expected identification code.
- Cause 1: Sleep Mode. If your Arduino sketch puts the MCU into deep sleep (e.g., using
LowPower.sleep()), the SWD clock is disabled. Solution: Hold the physical RESET button on the board, click Debug in VS Code, and release the RESET button exactly when OpenOCD attempts to connect. - Cause 2: SWD Pins Disabled. If your sketch accidentally reconfigures the SWDIO or SWCLK pins as standard GPIO outputs, the debug port is locked out. Solution: Use the 'Connect under Reset' feature in OpenOCD, or re-flash the bootloader using a standard UART serial connection to wipe the rogue GPIO configuration.
Windows: Zadig and WinUSB Driver Conflicts
On Windows, if OpenOCD hangs on 'Initializing interface', it is usually because a proprietary STMicroelectronics driver has claimed the USB device. OpenOCD requires the generic WinUSB driver. Download the Zadig utility, select your ST-Link from the dropdown, ensure 'WinUSB' is selected as the target driver, and click 'Replace Driver'.
Frequently Asked Questions
Can I use Arduino OpenOCD with the ESP32?
Yes, but the ESP32 uses Xtensa or RISC-V architectures, which require JTAG rather than SWD. You cannot use a standard ST-Link V2 for ESP32 debugging. You must use an FT2232H-based probe (like the ESP-Prog) and configure PlatformIO with debug_tool = esp-prog. OpenOCD handles the backend translation seamlessly.
Does debugging consume flash memory on the Arduino?
The debug symbols (-g3) significantly increase the size of the local .elf file on your PC, but they are not uploaded to the microcontroller's flash memory. The GDB server reads the symbols from your PC and maps them to the raw memory addresses on the chip. Therefore, your sketch size on the target remains identical to a standard release build.
Why do my Serial prints disappear when debugging?
When the CPU halts at a breakpoint, all peripherals—including the USB CDC or UART serial buffers—pause. If your host PC requests serial data while the MCU is halted, the buffer may overflow or timeout. It is best practice to use the GDB 'Watch' pane to monitor variables rather than relying on serial output during an active debug session.