
The True Nature of the Arduino IDE Verify Button
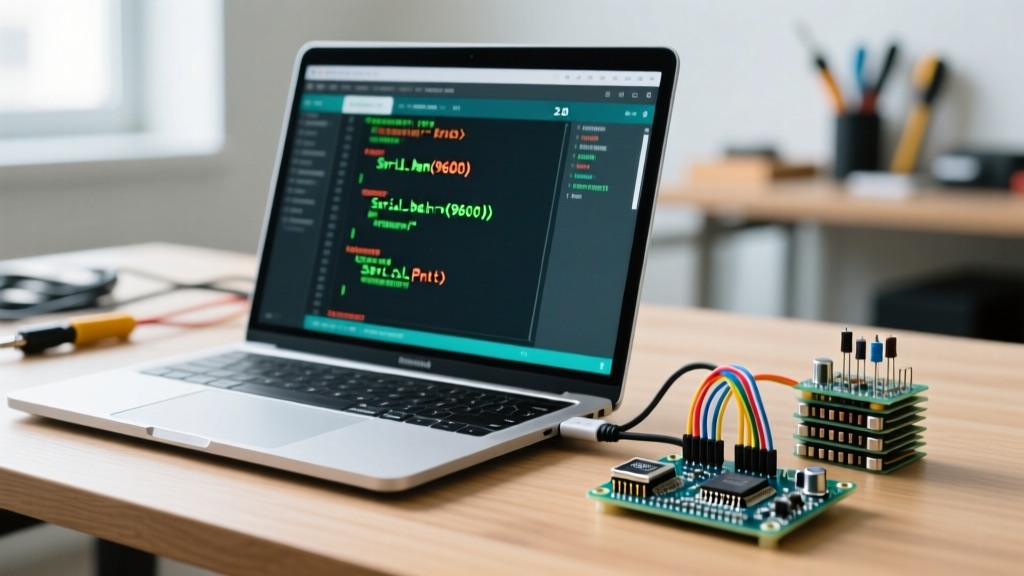
Most makers treat the Arduino IDE Verify button (the checkmark icon, or Ctrl+R / Cmd+R) as a simple syntax checker. In reality, clicking Verify triggers the full cross-compilation toolchain. It invokes the preprocessor, compiles C/C++ source files into object code, links them against the standard C library (libc) and the Arduino core, and generates the final binary payload. For advanced developers working with memory-constrained microcontrollers like the ATmega328P or ESP32, understanding and manipulating the Arduino IDE Verify process is the difference between a project that barely fits in flash memory and one that is highly optimized, robust, and production-ready.
In 2026, with Arduino IDE 2.3.x utilizing modern backend architectures and updated toolchains (like avr-gcc 14.x and xtensa-lx106-elf), the compilation pipeline offers deep diagnostic capabilities that go far beyond simple error highlighting.
Expert Insight: The Verify process does not execute your code on the board. It strictly performs static analysis, preprocessing, compilation, and linking. If your code compiles successfully but exhibits runtime anomalies, the issue lies in memory corruption, pointer mismanagement, or hardware timing—none of which the Verify button can catch.
Unlocking Verbose Output for Pipeline Diagnostics
By default, the Arduino IDE hides the complex command-line invocations behind a simplified progress bar. To master the Arduino IDE Verify process, you must expose the underlying GCC commands.
- Navigate to File > Preferences (or Arduino IDE > Settings on macOS).
- Check the box for Show verbose output during: compilation.
- Click Verify and observe the black console window.
Decoding the avr-g++ Invocation
When you review the verbose output, you will see the exact flags passed to the compiler. A standard invocation for an Arduino Uno looks like this:
avr-g++ -c -g -Os -Wall -Wextra -std=gnu++17 -fpermissive -fno-exceptions -ffunction-sections -fdata-sections -fno-threadsafe-statics -Wno-error=narrowing -MMD -flto -mmcu=atmega328p ...Understanding these flags is critical for advanced optimization:
- -ffunction-sections & -fdata-sections: Places each function and data item into its own section. This allows the linker (
-Wl,--gc-sections) to garbage-collect unused code, drastically reducing final flash usage. - -flto: Link Time Optimization. This allows the compiler to optimize across different translation units (e.g., your sketch and a linked library) during the linking phase, often saving 5-15% of flash memory.
- -Os: Optimizes for size. This is the default for AVR architectures where 32KB of flash is a hard limit.
Extracting and Profiling the .ELF Binary
The Arduino IDE Verify process generates an .elf (Executable and Linkable Format) file before converting it to the .hex file used for uploading. The .elf file contains vital debugging symbols, memory maps, and disassembly data that the .hex file strips away.
Locating the Hidden Build Directory
Arduino IDE 2.x stores build artifacts in a temporary directory. To find your .elf file, enable verbose output, click Verify, and look at the very first line of the compiler output. It will reveal the build path:
- Windows:
C:\Users\<User>\AppData\Local\Temp\arduino\sketches\<Hash>\ - macOS:
/var/folders/<Hash>/T/arduino/sketches/<Hash>/ - Linux:
/tmp/arduino/sketches/<Hash>/
Memory Mapping with avr-nm
Once you locate the .elf file, you can use the avr-nm tool (included in the Arduino AVR boards package) to map exactly which variables and functions are consuming your SRAM. Open your terminal and run:
avr-nm --size-sort -S sketch.elf | grep ' [bBdD] ' | tail -n 20This command sorts all initialized (d) and uninitialized (b) data sections by size, revealing the top 20 SRAM hogs. This is an indispensable technique when debugging stack overflows or dynamic memory fragmentation on 8-bit AVR chips.
Advanced Optimization: Tuning Compiler Flags
While the Arduino IDE abstracts the build system, advanced users can override default compiler behaviors by modifying the platform.txt file or injecting build flags directly into the sketch using specific pragmas or IDE configurations.
According to the official GCC Optimize Options documentation, tweaking optimization levels can drastically alter the binary footprint. Below is a comparison matrix of GCC optimization flags and their real-world impact on an ATmega328P running a complex sensor-fusion sketch.
| Compiler Flag | Flash Impact | SRAM Impact | Execution Speed | Best Use Case |
|---|---|---|---|---|
-O0 |
+45% (Bloated) | Baseline | Slowest | Strict debugging (prevents variable optimization) |
-O1 |
Baseline | -5% | Fast | Basic sketches, fast compilation times |
-O2 |
+12% | -10% | Faster | Performance-critical loops, DSP math |
-O3 |
+35% | -15% | Fastest | Heavy computational tasks (unrolls loops aggressively) |
-Os |
-15% | -10% | Fast | Default AVR (Optimizes for size over raw speed) |
-Oz |
-22% | -12% | Slower | Extreme flash constraints (disables some loop unrolling) |
To force a specific optimization level in Arduino IDE 2.x without breaking the core, you can use the build.extra_flags property in a custom boards.txt entry, or utilize the __attribute__((optimize("O3"))) directive on specific performance-critical functions within your C++ code.
Resolving Complex Linker Errors During Verification
A common advanced failure mode occurs when the Arduino IDE Verify process passes the compilation stage but fails catastrophically during the linking stage. The most notorious of these is the undefined reference to error.
The extern "C" Name Mangling Trap
If you are integrating legacy C libraries or writing custom drivers in C for an Arduino C++ sketch, the Verify process will often fail with a linker error. This happens because the C++ compiler "mangles" function names to support overloading, while the C compiler does not.
To resolve this, you must wrap your C headers in an extern "C" block to instruct the C++ compiler to use C-style linkage:
#ifdef __cplusplus
extern "C" {
#endif

void legacy_c_function(uint8_t pin);

#ifdef __cplusplus
}
#endif
Furthermore, if you are linking against pre-compiled static libraries (.a files), ensure the library was compiled with the exact same avr-gcc version and ABI settings as your current Arduino core. Mismatched toolchains will result in silent memory corruption or hard faults at runtime, even if the Verify button reports success.
Transitioning to Arduino CLI for Automated Verification
For professional firmware development, relying on the GUI's Verify button is insufficient. Modern embedded workflows require Continuous Integration/Continuous Deployment (CI/CD). The Arduino CLI Documentation provides the exact framework needed to automate the Verify process in environments like GitHub Actions or GitLab CI.
By using the CLI, you can enforce strict compilation rules, treat warnings as errors, and generate memory reports automatically:
arduino-cli compile --fqbn arduino:avr:uno --warnings all --build-property compiler.cpp.extra_flags="-Werror" ./my_sketchThis command replicates the Arduino IDE Verify process but elevates all warnings to fatal errors (-Werror), ensuring that implicit type conversions or unused variables halt the build pipeline before flawed firmware reaches the hardware testing stage.
Analyzing the Linker Map File
To deeply understand how the AVR Libc Memory Sections are allocated during verification, you can force the linker to generate a map file. Add the following to your platform.local.txt file in the Arduino hardware directory:
compiler.c.elf.extra_flags=-Wl,-Map,{build.path}/sketch.mapAfter clicking Verify, the sketch.map file will detail every single byte of flash and SRAM, showing exactly where the .text, .data, and .bss sections are placed. This level of granularity is mandatory when porting complex RTOS environments or writing custom bootloaders where memory boundaries are measured in single bytes.
Summary
Mastering the Arduino IDE Verify process requires looking past the user interface and engaging directly with the GCC toolchain. By leveraging verbose output, extracting ELF binaries for memory profiling, applying targeted optimization flags, and automating the pipeline via Arduino CLI, you transition from a hobbyist sketching code to an embedded engineer crafting optimized, production-grade firmware.