
The Paradigm Shift: Arduino IDE 2.x and ESP32 Core v3.0
For years, developers asking how to debug ESP32-WROOM-32 in Arduino IDE were met with a frustrating answer: you cannot do it natively without switching to PlatformIO or ESP-IDF. Historically, Arduino IDE 1.x relied entirely on serial printf debugging and post-mortem log analysis. However, the landscape has fundamentally changed. With the widespread adoption of Arduino IDE 2.3+ and the maturation of the ESP32 Arduino Core v3.x, developers now have access to native GDB (GNU Debugger) integration, hardware JTAG support, and advanced core dump analysis directly within the familiar Arduino ecosystem.
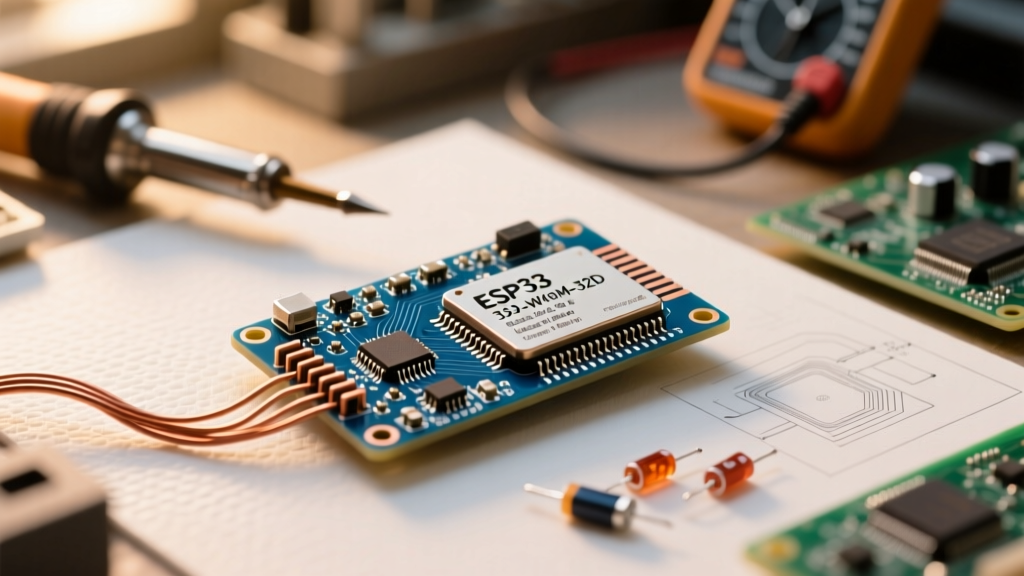
The ESP32-WROOM-32 module, powered by the dual-core Xtensa LX6 microcontroller and equipped with 520KB of SRAM, is a powerhouse for IoT and edge computing. But its FreeRTOS-based environment and complex memory management unit (MMU) make traditional serial logging insufficient for tracking down race conditions, stack overflows, and memory leaks. This deep dive explores the three most effective methodologies to debug the ESP32-WROOM-32 in Arduino IDE today, ranging from zero-cost software stubs to professional-grade JTAG hardware setups.
Method 1: Hardware JTAG Debugging (The Professional Standard)
Hardware debugging via JTAG (Joint Test Action Group) allows you to set breakpoints, step through code line-by-line, inspect CPU registers, and monitor live memory variables without halting the UART serial output. To achieve this in Arduino IDE 2.x, you need an external JTAG adapter and specific wiring to the ESP32-WROOM-32's internal JTAG interface.
Required Hardware and Wiring Matrix
For most hobbyists and professional prototypers, the official ESP-Prog ($15–$20) or a Segger J-Link EDU ($60) are the most reliable adapters. The ESP32-WROOM-32 routes its JTAG signals through specific GPIO pins that are multiplexed with other functions. Below is the exact wiring matrix required to bridge the ESP-Prog to the WROOM-32 breakout board:
| ESP32-WROOM-32 GPIO | JTAG Signal | ESP-Prog Pin (10-Pin Header) | Primary Function Conflict |
|---|---|---|---|
| GPIO 12 | MTDI | Pin 5 (TDI) | HSPI MISO / Flash Voltage Strap |
| GPIO 13 | MTCK | Pin 3 (TCK) | HSPI MOSI / SDIO |
| GPIO 15 | MTDO | Pin 1 (TDO) | HSPI CS / Boot Log Output |
| GPIO 14 | MTMS | Pin 7 (TMS) | HSPI CLK / SDIO |
Note: You must also connect GND to GND, and ensure the ESP-Prog is providing 3.3V to the ESP32 VCC pin (or share a common ground if powered separately).
The GPIO12 Strapping Pin Trap (Critical Edge Case)
When learning how to debug ESP32-WROOM-32 in Arduino IDE via JTAG, the most common point of failure is the boot-loop caused by GPIO12. According to the Espressif JTAG Debugging Guide, GPIO12 (MTDI) is a strapping pin used to determine the external SPI flash voltage. The WROOM-32 utilizes 3.3V flash, which requires GPIO12 to be pulled LOW during boot.
Expert Troubleshooting Tip: Many JTAG adapters pull the TDI line HIGH by default. If your ESP32 resets while the JTAG adapter is connected, the chip will read GPIO12 as HIGH, incorrectly configure the flash regulator for 1.8V, and immediately crash with a "flash read err" panic. To fix this, either add a 10kΩ pull-down resistor on GPIO12, or physically disconnect the MTDI wire, press the EN (Reset) button, and reconnect MTDI immediately after boot.
Configuring Arduino IDE 2.x for JTAG
- Open your sketch in Arduino IDE 2.x.
- Navigate to Tools > JTAG Adapter and select ESP-Prog (or your specific adapter).
- Ensure your board is set to ESP32 Dev Module and the correct COM port is selected.
- Click the Start Debugging icon (the bug symbol) in the top left toolbar.
- The IDE will compile, flash the binary via the UART bridge, and then hand control over to the JTAG adapter to halt the CPU at your first breakpoint.
Method 2: Zero-Cost GDB Stub via Serial UART
If you do not have a JTAG adapter, the ESP32 Arduino Core v3.x includes a built-in GDB stub that operates over the standard serial UART connection. This method is invaluable for field debugging or when working with minimal hardware budgets. When a fatal exception (Guru Meditation Error) occurs, the GDB stub intercepts the panic, halts the FreeRTOS scheduler, and waits for a GDB client to connect via the serial port.
To enable this, navigate to Tools > JTAG Adapter and select None (GDB Stub). Then, set Tools > Core Debug Level to Debug or Verbose. When your code triggers a panic (e.g., a null pointer dereference or a watchdog timeout), the serial monitor will output a message indicating the GDB stub is listening. You can then use the xtensa-esp32-elf-gdb toolchain via the command line to attach to the serial port, inspect the backtrace, and read memory registers at the exact moment of failure. While this does not support live breakpoints like hardware JTAG, it provides a complete post-mortem snapshot of the CPU state without requiring the Arduino IDE 2.x Debugger GUI.
Method 3: Post-Mortem Analysis with EspExceptionDecoder
For developers who prefer to keep their workflow entirely within the standard serial monitor, the EspExceptionDecoder remains a vital tool. When the ESP32-WROOM-32 crashes, it dumps a hexadecimal backtrace to the serial console:
Backtrace: 0x400d1a2b:0x3ffb1c00 0x40082b4a:0x3ffb1c20 0x40089c12:0x3ffb1c40
These hex addresses are meaningless to the human eye but map directly to your compiled C++ source code. By installing the EspExceptionDecoder plugin (available via the Arduino IDE Library/Plugin manager or as a standalone Python script), you can paste this backtrace into the decoder. The tool utilizes the xtensa-esp32-elf-addr2line utility to translate the memory addresses back into exact file names and line numbers. This is particularly effective for tracking down asynchronous crashes in Wi-Fi or Bluetooth callback functions where the crash occurs outside the main loop().
Debugging Method Comparison Matrix
Choosing the right debugging strategy depends on your project constraints, budget, and the nature of the bug. Use the following matrix to select the optimal approach:
| Feature | Hardware JTAG (ESP-Prog) | Software GDB Stub (UART) | Serial Logging / Exception Decoder |
|---|---|---|---|
| Hardware Cost | $15 - $60 | $0 (Uses existing USB-UART) | $0 |
| Live Breakpoints | Yes (Hardware & Software) | No (Post-mortem only) | No |
| Variable Inspection | Real-time | At moment of panic only | Manual via Serial.print |
| Performance Impact | Negligible | Increases binary size slightly | High (UART blocking delays) |
| Best Use Case | Race conditions, RTOS tasks | Hard faults, Watchdog resets | Logic errors, API integration |
Advanced Troubleshooting: Flash Encryption and Secure Boot
A frequent edge case encountered when attempting to debug the ESP32-WROOM-32 in Arduino IDE involves production-grade security features. If you have enabled Flash Encryption or Secure Boot v2 via the Arduino IDE menu (or previously via ESP-IDF menuconfig), standard JTAG debugging will fail. The ESP32's eFuses permanently disable the JTAG interface by default when these security features are burned to prevent malicious actors from dumping encrypted firmware or injecting code.
According to the ESP32 Arduino Core Troubleshooting Documentation, if you must debug a device with Flash Encryption enabled, you must use the espefuse.py tool to burn the DIS_USB_JTAG and HARD_DIS_JTAG eFuses to 0 before enabling encryption. Note that this permanently compromises the physical security of the chip, making it unsuitable for deployed consumer IoT devices, but necessary for development boards undergoing cryptographic testing.
Summary
Mastering how to debug ESP32-WROOM-32 in Arduino IDE requires moving beyond simple serial prints. By leveraging the native GDB integration in Arduino IDE 2.x, wiring a dedicated ESP-Prog for JTAG, and understanding the critical hardware traps like the GPIO12 strapping pin, you can drastically reduce your development cycle. Whether you are tracking down a elusive heap corruption in a FreeRTOS task or analyzing a Wi-Fi stack panic, the modern Arduino ecosystem now provides the professional-grade tooling required to conquer the Xtensa LX6 architecture.