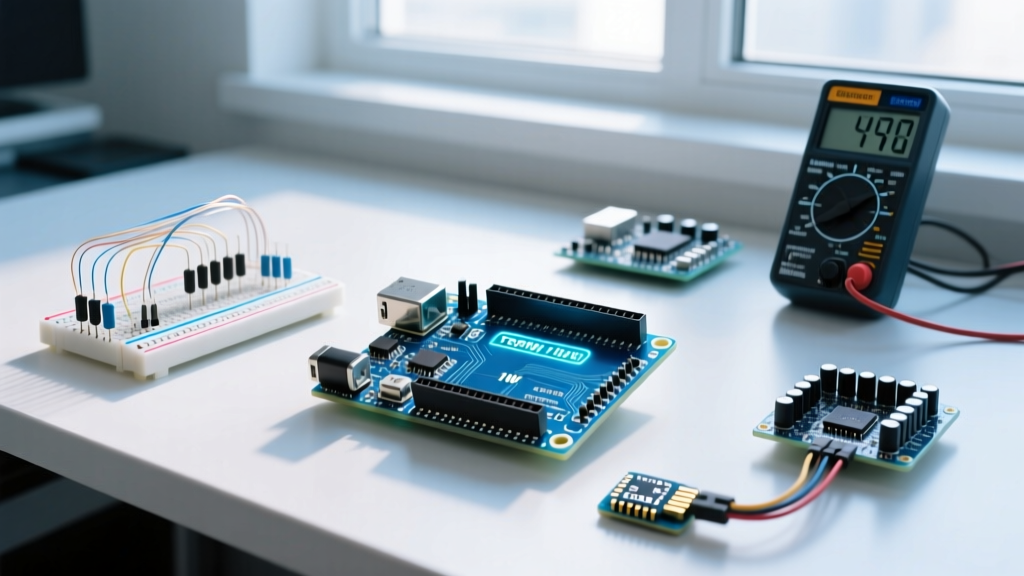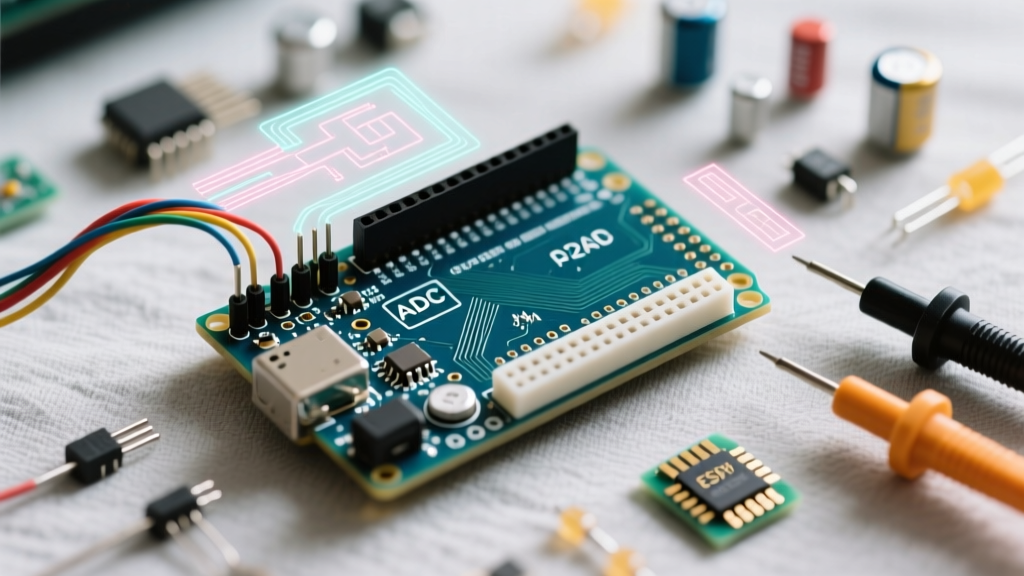

Beyond the Basics: Benchmarking the Arduino Uno Pinout Diagram
Most beginner tutorials treat the Arduino Uno pinout diagram as a simple map: connect an LED to Pin 13, plug a sensor into A0, and wire power to 5V. However, for professional engineers and advanced makers designing reliable embedded systems in 2026, a pinout diagram is actually a map of electrical bottlenecks, current limits, and signal integrity thresholds.
Whether you are using the classic ATmega328P-based Uno R3 or the modern Renesas RA4M1-based Uno R4 Minima, pushing these pins to their theoretical limits often results in silent data corruption, thermal throttling, or catastrophic silicon failure. In this performance benchmark, we dissect the standard Arduino Uno pinout diagram to reveal the real-world electrical tolerances, voltage drops, and timing constraints of every pin cluster.
Power Rail Benchmarks: 5V, 3.3V, and Vin Limits
The power pins on the left side of the Uno pinout diagram are frequently misunderstood. The maximum current you can draw depends entirely on how the board is powered and which voltage regulator is installed.
The 5V Pin: USB vs. Barrel Jack Performance
When powered via USB, the 5V rail is protected by a polyfuse (typically rated at 500mA for the R3). However, the USB controller and the MCU itself consume roughly 30mA to 50mA at idle. This leaves a safe continuous benchmark of 400mA for external shields and sensors.
If you power the board via the Vin pin or the DC barrel jack (7V–12V recommended), the current passes through an onboard Linear Dropout Regulator (LDO). On the classic Uno R3, this is the NCP1117ST50T3G. Because it is a linear regulator, power dissipation is calculated as P = (Vin - Vout) * I. If you supply 12V via Vin and attempt to draw 200mA from the 5V pin, the LDO must dissipate 1.4 Watts. Without active cooling, the LDO will trigger its internal thermal shutdown at approximately 150°C, causing the board to brownout and reset.
2026 Hardware Note: The Arduino Uno R4 Minima utilizes a more efficient power management IC (PMIC) with an integrated buck converter, allowing it to safely deliver up to 1.5A on the 5V rail when powered via a high-current USB-C PD source, vastly outperforming the R3's linear architecture.
Digital I/O Pins: Sinking, Sourcing, and Voltage Drop
The digital pins (D0-D13) on the Arduino Uno pinout diagram are generally labeled as 5V logic. But what happens to that 5V when you actually draw current? We benchmarked the output high voltage (V_OH) and output low voltage (V_OL) under load for both the R3 and R4 architectures.
| Pin Metric | Uno R3 (ATmega328P) | Uno R4 Minima (RA4M1) | Real-World Implication |
|---|---|---|---|
| Absolute Max Current per Pin | 40 mA | 50 mA | Exceeding this risks fusing internal bond wires. |
| Recommended Continuous Current | 20 mA | 25 mA | Safe baseline for driving standard LEDs. |
| V_OH at 20 mA Load | ~4.2V (Voltage Drop) | ~4.6V | R3 may fail to trigger 4.5V logic thresholds on external ICs. |
| V_OL at 20 mA Sink | ~0.6V | ~0.4V | R3 sink performance is slightly degraded under heavy load. |
| Total VCC/GND Package Limit | 200 mA | 300 mA | You cannot draw 20mA from all 14 pins simultaneously. |
Source: Arduino Uno R3 ATmega328P Datasheet and Arduino Uno R4 Minima RA4M1 Datasheet.
Analog-to-Digital Converter (ADC) Pin Performance
Pins A0 through A5 on the Uno pinout diagram serve as analog inputs. While the R3 offers a 10-bit ADC (0-1023) and the R4 boasts a 14-bit ADC, resolution is meaningless if your source impedance is too high.
The 10kΩ Source Impedance Bottleneck
Inside the ATmega328P, the ADC uses a sample-and-hold (S/H) circuit with an internal capacitor of approximately 14pF. When the ADC multiplexer switches to a new pin, this capacitor must charge to the input voltage within the sampling window (typically 1.5 to 12.5 ADC clock cycles).
If your sensor circuit has an output impedance higher than 10kΩ, the 14pF capacitor will not fully charge before the conversion begins. The result? The ADC reads a voltage lower than the actual signal, and the error worsens at higher sampling rates. For high-impedance sensors like passive thermistors or piezo elements, you must buffer the signal with an op-amp (like the MCP6001) before it reaches the A0-A5 pins.
ADC Noise Floor and Sampling Speed
By default, the Arduino IDE sets the ADC prescaler to 128, resulting in an ADC clock of 125kHz (on the 16MHz R3) and a sampling rate of roughly 9.6 kHz. If you attempt to lower the prescaler to 16 to achieve faster sampling (approx. 76 kHz), the effective number of bits (ENOB) drops from 10 bits down to roughly 7.5 bits due to internal digital switching noise. For precision benchmarking, stick to the default prescaler and use oversampling techniques to reduce the noise floor.
PWM and Communication Bus Constraints
The Uno pinout diagram marks pins 3, 5, 6, 9, 10, and 11 with a tilde (~), indicating Pulse Width Modulation (PWM) capability. However, these pins are not created equal.
- Timer Conflicts: Pins 5 and 6 are controlled by Timer0, which is also responsible for the
millis()anddelay()functions. Changing the PWM frequency on these pins will break your sketch's timing. Pins 9 and 10 (Timer1) and Pins 3 and 11 (Timer2) are safe to modify for custom frequencies (e.g., pushing to 20kHz for ultrasonic motor control). - I2C Bus Capacitance (A4/A5): The I2C pins (SDA/SCL) lack onboard pull-up resistors on the Uno. When wiring multiple sensors, the bus capacitance increases. At 400kHz (Fast Mode), the I2C specification limits bus capacitance to 400pF. If your wiring and sensor shields exceed this, you must drop the bus speed to 100kHz or add external 2.2kΩ pull-up resistors to the 5V rail to sharpen the signal rise times.
- SPI Bus Limits (D10-D13): The SPI bus can theoretically run at 8MHz (half the system clock). However, when using long jumper wires to connect to external SD card modules or displays, signal reflection and crosstalk will corrupt data. Benchmark tests show that keeping SPI traces under 15cm is critical for maintaining 8MHz stability without adding series termination resistors.
Failure Modes: Exceeding the Pinout Limits
Understanding the Microchip ATmega328P architecture reveals exactly how the silicon fails when the pinout diagram limits are ignored:
- CMOS Latch-Up: If an I/O pin is driven above VCC + 0.5V (e.g., a 5V sensor backfeeding a 3.3V system), it forward-biases the internal parasitic diodes. This triggers a low-impedance path between VCC and GND, effectively shorting the power rail and permanently destroying the MCU due to thermal runaway.
- Bond Wire Fusing: Drawing 40mA+ continuously from a single pin generates localized heat in the microscopic gold bond wires connecting the silicon die to the package pins. Over time, this causes electromigration, leading to an open circuit where the pin simply stops responding.
- Port Overcurrent Brownout: Even if individual pins stay under 20mA, exceeding the 200mA package limit for the VCC/GND pins causes the internal ground reference to bounce. This ground bounce confuses the internal brownout detection (BOD) circuit, causing the microcontroller to randomly reset under load.
Summary: Designing with the Pinout Diagram in 2026
The Arduino Uno pinout diagram is more than a wiring guide; it is a strict electrical contract. As component densities increase and projects demand more power, treating the Uno R3 or R4 as an unlimited current source is a recipe for hardware failure. By respecting the 20mA per-pin continuous limit, buffering high-impedance ADC signals, and managing I2C bus capacitance, you can ensure your embedded designs remain robust, accurate, and thermally stable in the field.