Staring at a scrolling wall of text in the Serial Monitor is a rite of passage for every maker, but as projects scale from blinking LEDs to complex environmental controllers, text-based debugging becomes a severe workflow bottleneck. Integrating a robust graphical interface for Arduino projects is no longer a luxury reserved for commercial products; it is a critical optimization strategy for rapid prototyping, real-time telemetry, and end-user deployment in 2026.
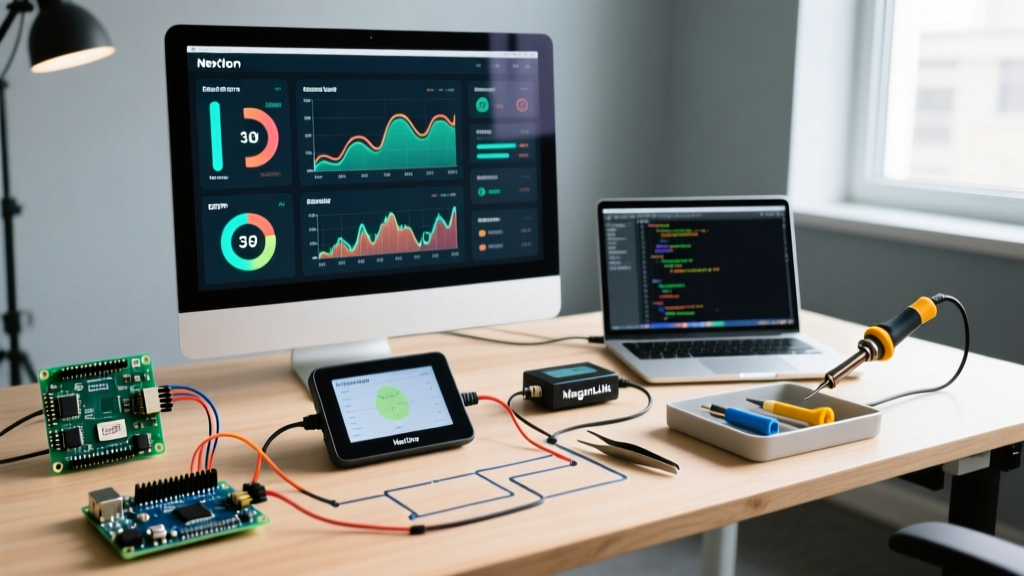
Transitioning from Serial.println() to a visual dashboard reduces debugging time, prevents cognitive overload during live testing, and allows for immediate parameter tweaking without recompiling your sketch. This guide breaks down the most effective GUI ecosystems—ranging from hardware-based HMI screens to PC-side telemetry software—and details how to architect your firmware to support them without blocking your main control loop.
The Serial Monitor Bottleneck
The native Arduino Serial Monitor is an invaluable tool for basic string output. However, when managing multi-sensor arrays or PID tuning, it fails as a workflow tool for three reasons:
- Cognitive Overload: Parsing raw comma-separated values (CSV) to identify a failing I2C sensor in real-time is error-prone.
- Lack of Bidirectional Control: Sending commands back to the MCU requires typing into the input box and hoping you didn't introduce a typo that crashes your parser.
- No Persistent Telemetry: Graphing historical data requires third-party wrappers or manual CSV exports.
By implementing a dedicated graphical interface, you offload the visualization layer, allowing your brain to focus on logic optimization rather than data translation.
Evaluating the Best GUI Ecosystems
Choosing the right graphical interface for Arduino depends entirely on whether your project requires a standalone hardware display or a tethered PC-based dashboard. Below is a workflow comparison matrix of the top solutions available in 2026.
| Solution | Type | Est. Cost (2026) | Setup Time | Best Workflow Use Case |
|---|---|---|---|---|
| Nextion HMI | Hardware (UART) | $44 - $85 | Medium | Standalone consumer appliances, kiosk interfaces |
| Processing IDE | PC-Side (Java) | Free | High | Custom data visualization, complex generative art |
| Meguno | PC-Side (C#/.NET) | Free | Low | Rapid data logging, PID tuning, quick graphing |
| LVGL (via ESP32-S3) | Embedded (SPI) | $12 - $25 | Very High | High-end commercial UI, smart home panels |
Hardware-Side GUIs: Mastering Nextion HMI
For standalone deployments where tethering a laptop is impossible, Nextion displays remain the undisputed champions of workflow optimization. Unlike raw TFT screens that require the Arduino to push every single pixel (consuming massive amounts of SRAM and CPU cycles), Nextion displays feature an onboard ARM processor. Your Arduino only sends lightweight UART text commands to update variables.
Optimizing the Nextion Workflow
The most popular entry-point model is the NX4832T035_011 (3.5-inch Basic, 480x320 resolution), which typically retails around $45. To optimize your development workflow, follow these hardware and firmware rules:
- Baud Rate Alignment: The default Nextion baud rate is 9600 bps. This is too slow for real-time graphing. In the Nextion Editor, add a
bauds=115200command to the 'Program.s' initialization page. Match this in your ArduinoSerial.begin(115200)to ensure smooth slider and waveform updates. - Power Isolation: A common failure mode is screen flickering or random reboots. The 3.5-inch Nextion can pull upwards of 300mA when the backlight is maxed out. Do not power it from the Arduino Uno's 5V pin, which is limited by the onboard USB polyfuse. Use a dedicated 5V 2A buck converter wired in parallel to your MCU's ground.
- Command Termination: Every command sent to the display must be terminated with three bytes of
0xFF. Forgetting this will cause the display's UART buffer to hang, waiting for the end-of-frame signal.
Expert Insight: When designing your Nextion interface, utilize the built-in 'Waveform' component for live sensor data. Pushing an array of 100 bytes via Serial to the waveform channel takes less than 9 milliseconds at 115200 baud, keeping your Arduino's main loop entirely unblocked.
PC-Side GUIs: Processing and Meguno
When your workflow demands heavy data logging, complex mathematical visualization, or rapid PID tuning on a workbench, PC-side GUIs eliminate the need to purchase and wire external hardware.
Meguno: The Rapid Telemetry Tool
Meguno is a lightweight Windows application designed specifically for Arduino telemetry. It bridges the gap between raw serial data and visual graphs without requiring you to write a single line of PC-side code. By including the Meguno.h library in your sketch, you can instantiate a TimePlot object. Sending data is as simple as MyPlot.SendData("Temperature", sensorValue). Meguno automatically parses the serial stream, plots the data in real-time, and allows one-click CSV exports for post-analysis.
Processing: Custom Visual Dashboards
For highly customized visualizations, Processing's Serial Library allows you to build bespoke dashboards using Java. While the learning curve is steeper, the workflow payoff for repetitive testing is immense. By combining Processing with the ControlP5 GUI library, you can create interactive sliders that write values directly to your Arduino's EEPROM or RAM via serial commands, allowing you to tune motor controllers or sensor thresholds on the fly without re-uploading firmware.
Advanced Embedded GUIs: LVGL on ESP32-S3
If your project requires a premium, smartphone-like interface, Light and Versatile Graphics Library (LVGL) is the industry standard. In 2026, running LVGL on a classic Arduino Uno is impossible due to memory constraints, but pairing LVGL with an ESP32-S3 module and an ST7701S RGB parallel display yields stunning results.
Using tools like SquareLine Studio, you can design your UI visually on your PC and export the C code directly into the Arduino IDE or PlatformIO. The workflow optimization here lies in separating the UI logic from the hardware logic using FreeRTOS tasks—assigning the UI rendering to Core 0 and your sensor polling/WiFi management to Core 1.
Step-by-Step: Transitioning to a Non-Blocking GUI Architecture
The most critical mistake makers make when adding a graphical interface for Arduino is using delay() to manage screen updates. This destroys the responsiveness of physical buttons and sensor interrupts. To optimize your workflow, you must adopt a state-machine approach to GUI polling.
The Non-Blocking Polling Pattern
Instead of halting the CPU to wait for a screen response, use a millis() based timer to check the serial buffer only when necessary. Here is the structural workflow for integrating a Nextion or PC-side GUI without blocking:
- Initialize Timestamps: Create an
unsigned long lastGUIUpdate = 0;variable. - Define the Interval: Set a constant
const int GUI_INTERVAL = 50;(updating the screen at 20 FPS is visually smooth and saves CPU cycles). - Check and Execute: In your main
loop(), check ifmillis() - lastGUIUpdate >= GUI_INTERVAL. If true, push your sensor data to the GUI and reset the timestamp. - Asynchronous Listening: Use an event-driven approach (like
serialEvent()or a dedicated hardware serial interrupt) to listen for incoming GUI commands (like a button press on the screen) so they are processed the millisecond they arrive.
Expert Troubleshooting & Edge Cases
Even with a well-architected GUI workflow, edge cases will arise. Keep this troubleshooting matrix handy for your workbench:
- GUI Lagging Behind Physical Sensors: You are likely pushing too much string data. Switch from sending formatted text (e.g.,
"Temp: 25.4 C") to raw binary bytes or integers. The Arduino Serial API handles binary transmission significantly faster than ASCII string conversion. - Nextion Screen 'Touch Timeout': If the screen stops registering touches, check your UART wiring. A floating RX pin on the display can pick up EMI noise from nearby relays or motors, flooding the display's internal buffer and causing the touch controller to freeze. Always use a 10k pull-up resistor on the RX line.
- Processing Dashboard Disconnects: When using PC-side GUIs, pressing the 'Reset' button on your Arduino or uploading new code will drop the serial port. Implement an automatic reconnection loop in your Processing sketch using a
try-catchblock around theSerial.list()function to seamlessly re-establish the handshake.
Conclusion
Upgrading from a text-based serial monitor to a dedicated graphical interface for Arduino is a transformative workflow optimization. Whether you choose the standalone reliability of a Nextion HMI, the rapid telemetry of Meguno, or the bespoke power of Processing, decoupling your visualization layer from your core logic will result in cleaner code, faster debugging, and a vastly superior end-user experience. Evaluate your specific telemetry needs, implement non-blocking state machines, and let your GUI do the heavy lifting of data translation.