
The Reality of ESP32 Crashes: Beyond the Hex Dump
Every embedded developer working with the ESP32 has experienced the dreaded "Guru Meditation Error." You upload your sketch, the serial monitor connects, and suddenly the console floods with an incomprehensible wall of hexadecimal register dumps and memory addresses. Without the ESP32 exception decoder, this backtrace is practically useless. You know the chip panicked, but you have no idea which line of C++ code triggered the fault.
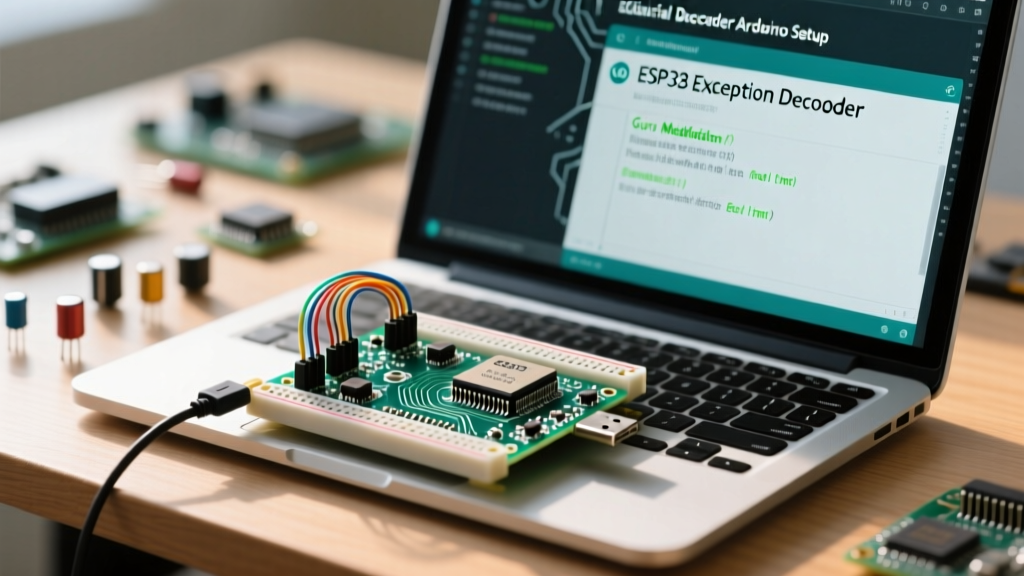
Configuring an exception decoder bridges the gap between raw hardware faults and your high-level Arduino sketch. By leveraging the xtensa-esp32-elf-addr2line toolchain utility, the decoder maps instruction pointers back to your exact source code files and line numbers. This guide provides a comprehensive configuration framework for Arduino IDE 2.x, PlatformIO, and legacy 1.8.x environments, ensuring you never have to guess the cause of a stack overflow or null pointer dereference again.
Anatomy of a Guru Meditation Error
Before configuring the decoder, it is critical to understand what the ESP32 is actually outputting during a fatal crash. According to the Espressif Fatal Errors Documentation, a standard panic dump contains three vital components:
- The Exception Cause: e.g.,
Core 1 panic'ed (StoreProhibited). This tells you the type of hardware violation. - The Register Dump: Specifically the
PC(Program Counter), which holds the address of the instruction that caused the crash, andEXCVADDR(Exception Virtual Address), which holds the memory address the CPU was trying to illegally access. - The Backtrace: A sequence of memory addresses representing the call stack at the moment of the crash, formatted as
Instruction_Address:Stack_Pointer_Address.
A raw backtrace looks like this: Backtrace: 0x400d10a8:0x3ffb1f00 0x400d10f5:0x3ffb1f20. The decoder intercepts this string, extracts the 0x400d10a8 instruction addresses, and queries the compiled .elf binary to return src/main.cpp:142.
Configuration Method 1: Arduino IDE 2.x (The Modern Standard)
Arduino IDE 2.x introduced significant improvements to serial monitor parsing, but automatic backtrace decoding is not always enabled by default or can fail if the build cache is cleared prematurely.
Step-by-Step IDE 2.x Setup
- Enable Verbose Compilation: Navigate to File > Preferences and check "Show verbose output during: compilation". This forces the IDE to retain the
.elffile in the temporary build directory, which the decoder requires to map symbols. - Verify Core Version: Ensure you are using ESP32 Arduino Core v2.0.5 or newer (preferably v3.x). Espressif integrated native backtrace parsing into the core's runtime panic handler in later releases.
- Serial Monitor Configuration: Open the Serial Monitor. When a crash occurs, the IDE 2.x serial monitor background service automatically attempts to detect the
Backtrace:keyword and invoke the bundledaddr2linebinary.
Expert Insight: If IDE 2.x fails to decode the backtrace and outputs "??:0", it is almost always because your antivirus software quarantined or blocked the execution of
xtensa-esp32-elf-addr2line.exelocated deep within the~/.arduino15/packages/esp32/tools/directory. Whitelist your Arduino15 folder to resolve this.
Configuration Method 2: PlatformIO (The Professional Choice)
For complex projects involving multiple files, custom partitions, or PSRAM configurations, PlatformIO remains the gold standard. The PlatformIO Monitor Filters system includes a dedicated, highly reliable ESP32 exception decoder.
Configuring platformio.ini
To enable automatic decoding, you must add the esp32_exception_decoder filter to your environment configuration. Open your platformio.ini file and modify it as follows:
[env:esp32dev]
platform = espressif32
board = esp32dev
framework = arduino
monitor_speed = 115200
monitor_filters =
    default
    time
    esp32_exception_decoder
build_type = debug
Critical Detail: Notice the build_type = debug flag. By default, PlatformIO compiles with optimization flags (-Os) that strip out debugging symbols to save flash space. Adding the debug flag ensures the DWARF debug information is preserved in the firmware binary, allowing the decoder to pinpoint exact line numbers rather than just function names.
Configuration Method 3: Legacy Arduino IDE 1.8.x (Python Script)
If you are maintaining legacy systems or are locked into Arduino IDE 1.8.19, you must use the standalone Python script method. This requires Python 3.x installed on your host machine.
- Download the
esp32_exception_decoder.pyscript from the official Espressif Arduino ESP32 GitHub repository (located in thetoolsdirectory). - Locate your compiled
.elffile. In IDE 1.8.x, go to Sketch > Export Compiled Binary, then navigate to your sketch folder'sbuilddirectory to find the.elffile. - Execute the script via your terminal, piping the serial output into it:
python3 esp32_exception_decoder.py /dev/ttyUSB0 115200 /path/to/your/sketch.elfThis script acts as a proxy serial monitor, intercepting the raw hex dump and printing the decoded C++ stack trace directly to your terminal in real-time.
The Exception Cause Matrix: Diagnosing the Fault
Decoding the line number is only half the battle. You must also understand why the CPU halted. Below is a matrix of the most common ESP32 exception codes encountered in Arduino development, mapped to their typical C++ root causes.
| Exception Code | Name | Typical C++ Root Cause | Hardware / Memory Context |
|---|---|---|---|
| 0x00 | IllegalInstruction | Executing data as code, or corrupted flash memory. | Often occurs when jumping to an uninitialized function pointer. |
| 0x06 | StoreProhibited | Null pointer dereference (writing to 0x00000000). |
Check EXCVADDR. If it is 0x0 or a very low number, you forgot to initialize an object or pointer. |
| 0x09 | LoadProhibited | Reading from an invalid or unmapped memory address. | Common when reading past the bounds of an array or accessing freed heap memory. |
| 0x1D | StoreAccessFault | Stack overflow or writing to read-only memory (ROM/Flash). | Usually caused by massive local variables or deep recursive calls exceeding the 8KB task stack. |
| 0x1E | LoadAccessFault | Reading from a misaligned memory address or protected region. | Frequent in custom I2S/DMA buffer implementations where 32-bit alignment is required. |
Advanced Troubleshooting: When the Decoder Fails
Even with perfect configuration, you may encounter scenarios where the decoder outputs ??:0 or fails to resolve symbols. Here is the professional troubleshooting framework for decoder failures.
1. The "Stripped Binary" Problem
If your decoder resolves the function name (e.g., loopTask(void*)) but fails to provide the file name and line number, your binary was stripped of DWARF debug symbols. In the ESP32 Arduino Core, certain board definitions or custom platform.txt modifications append the -s (strip) flag to the linker. You must locate your platform.txt file in the ESP32 hardware package directory and remove the -s flag from the recipe.c.combine.pattern line.
2. Core 0 vs Core 1 Task Stack Overflows
The ESP32 is dual-core. By default, Arduino sketches run on Core 1, while Wi-Fi and Bluetooth stacks run on Core 0. If your backtrace shows addresses in the 0x4008xxxx or 0x4009xxxx range, the crash occurred inside the FreeRTOS kernel or an ISR (Interrupt Service Routine), not your user code. The decoder will map this to FreeRTOS source files (like tasks.c or queue.c). This indicates you are performing blocking operations (like delay() or I2C.read()) inside an ISR, or you have starved the IDLE task, triggering the Task Watchdog Timer (TWDT).
3. Flash Mapping Anomalies (0x400D vs 0x4008)
Understanding memory mapping is crucial for validating decoder output. Instructions located in the 0x400Dxxxx range are executed directly from the SPI Flash (XIP - Execute In Place). Instructions in the 0x4008xxxx to 0x400Axxxx range are loaded into the internal IRAM (Instruction RAM). If your crash happens in IRAM, it is likely related to an interrupt handler or a function explicitly marked with the IRAM_ATTR macro. Ensure that any variables accessed within these IRAM functions are also placed in DRAM using the DRAM_ATTR macro, as flash cache is disabled during certain hardware interrupts, leading to immediate LoadAccessFault panics.
Summary of Best Practices
Mastering the ESP32 exception decoder transforms firmware debugging from a guessing game into a precise science. Always compile with debug symbols enabled, keep your toolchain paths whitelisted in your OS security settings, and cross-reference the decoded line numbers with the Exception Cause Matrix. By integrating PlatformIO's monitor filters or properly configuring Arduino IDE 2.x, you ensure that every Guru Meditation Error is immediately translated into actionable, line-specific C++ corrections.