The Evolution of Arduino Data Visualization in 2026
As microcontroller ecosystems mature, the days of simply printing comma-separated values to a basic serial terminal are behind us. In 2026, arduino data visualization demands robust pipelines capable of handling high-frequency sensor telemetry, multi-axis plotting, and cloud-synced dashboards. However, a persistent challenge for makers and embedded engineers remains: compatibility. Not every visualization platform supports every microcontroller architecture, and hardware limitations often dictate your software stack.
This comprehensive compatibility guide evaluates the top data visualization tools available today, mapping them against modern Arduino boards—including the ARM-based Uno R4, the nRF52840 Nano 33 BLE, and the powerhouse Portenta H7. We will dissect baud rate bottlenecks, library dependencies, and specific failure modes to ensure your next telemetry project doesn't stall at the upload phase.
Hardware Compatibility Matrix: Which Boards Support What?
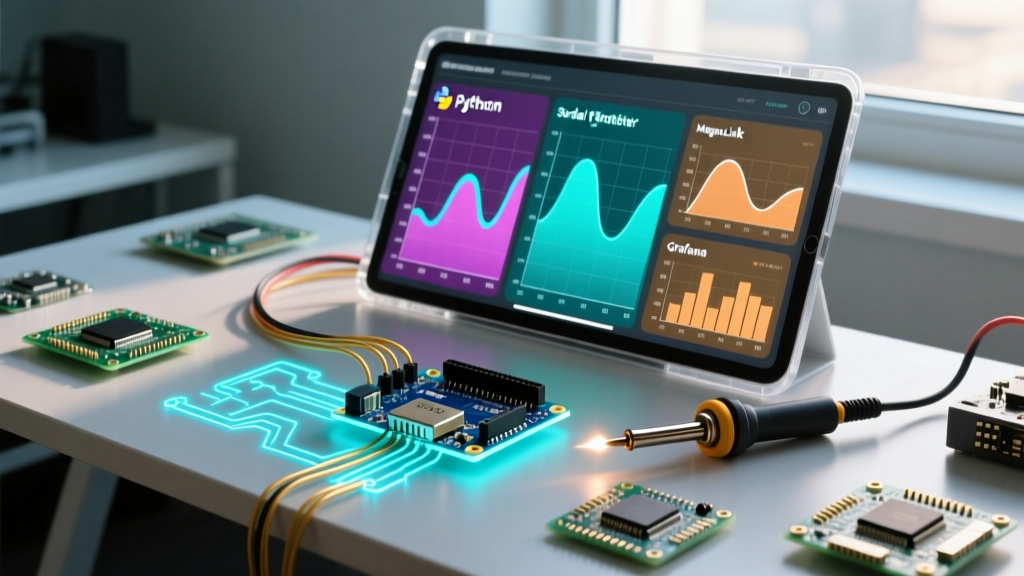
Before selecting a software platform, you must align your visualization tool with your MCU's hardware capabilities. The table below outlines native compatibility across four major Arduino architectures in 2026.
| Microcontroller Board | Architecture / MCU | IDE Serial Plotter | Python (PySerial) | MegunoLink | Grafana (MQTT/Cloud) |
|---|---|---|---|---|---|
| Arduino Uno R3 | AVR / ATmega328P | Yes (Limited) | Yes | Yes | No (Requires ESP Shield) |
| Arduino Uno R4 WiFi | ARM Cortex-M4 / RA4M1 | Yes | Yes | Yes | Yes (Native WiFi) |
| Nano 33 BLE Sense | ARM Cortex-M4 / nRF52840 | Yes | Yes | Yes | No (BLE requires Gateway) |
| Portenta H7 | ARM Cortex-M7 / STM32H747 | Yes | Yes | Yes | Yes (Native WiFi/Ethernet) |
| ESP32-S3 DevKit | Xtensa LX7 / Dual-Core | Yes | Yes | Yes | Yes (Native WiFi) |
Deep Dive: Top Visualization Platforms & Compatibility
1. Built-in Arduino IDE Serial Plotter (The Baseline)
The native Serial Plotter in Arduino IDE 2.3.x remains the most accessible entry point for arduino data visualization. It parses comma-separated strings terminated by a newline character (\r\n) and renders up to 500 historical data points.
- Best For: Quick PID tuning, basic sensor validation, and educational environments.
- Compatibility: Universal across all boards with a CDC-Serial or hardware UART-to-USB bridge.
- Limitations & Failure Modes: The IDE plotter struggles at sample rates exceeding 200Hz. On older AVR boards like the Uno R3, pushing 115200 baud with high-frequency
Serial.println()calls will overflow the 64-byte hardware UART buffer, causing severe loop latency and dropped data packets. Furthermore, it lacks CSV export natively, requiring third-party clipboard hacks.
Expert Tip: For official documentation on formatting multi-variable outputs, refer to the Arduino Serial Plotter Documentation. Always use
Serial.print(",")between variables andSerial.println()only at the end of the row.
2. Python with Matplotlib & PySerial (The Flexible Route)
For engineers requiring custom data filtering, FFT analysis, or high-framerate rendering, Python remains the undisputed king. By combining pyserial (v3.5+) with matplotlib.animation, you can build bespoke dashboards that run on Windows, macOS, and Linux.
- Best For: Cross-platform compatibility, machine learning data pipelines, and high-speed data logging (up to 2Mbps on ESP32-S3 native USB).
- Compatibility: Requires a standard USB-Serial connection. Works flawlessly with ARM and Xtensa boards. AVR boards require careful baud-rate matching (e.g., sticking to 57600 or 115200 to avoid AVR clock-division errors).
- Implementation Specifics: To achieve 60fps rendering without UI thread blocking, you must use Matplotlib's
blit=Trueparameter inFuncAnimation. On the MCU side, avoid usingStringobjects for serial formatting; instead, use C-stylesnprintf()to format payloads into a pre-allocated char array, preventing heap fragmentation on memory-constrained boards like the Nano 33 BLE.
3. MegunoLink (The Premium Windows Solution)
MegunoLink is a dedicated Windows application designed specifically for microcontroller telemetry. It bridges the gap between the simplistic IDE plotter and the overwhelming complexity of full-stack cloud dashboards.
- Best For: Professional field testing, robotics telemetry, and mapping GPS coordinates.
- Compatibility: Windows 10/11 only. It utilizes a custom Arduino library (
MegunoLink.h) that structures data using a specific command protocol (e.g.,Plot.Begin()). - Pricing & Value: The personal license costs $49.99. While not free, the time saved on UI development and the inclusion of features like XY scatter plots, map overlays, and automated CSV logging easily justifies the cost for commercial prototyping.
- Edge Case: Because MegunoLink relies on a specific serial protocol, mixing standard
Serial.println()debugging with MegunoLink commands on the same serial port will corrupt the parser. Always useSerial1(or a software serial alternative) for debugging if your board supports multiple hardware UARTs.
4. Grafana + InfluxDB (The IoT & Cloud Standard)
When your arduino data visualization needs to scale beyond a single USB cable to a global fleet of IoT devices, Grafana paired with an InfluxDB time-series database is the industry standard in 2026.
- Best For: Remote environmental monitoring, smart agriculture, and industrial IoT (IIoT).
- Compatibility: Strictly limited to network-capable boards. You must use the Arduino Uno R4 WiFi, Portenta H7, ESP32, or Nano RP2040 Connect. Standard AVR boards are incompatible without external network shields.
- Protocol Overhead: Data is typically transmitted via MQTT using JSON payloads. Parsing and generating JSON on an MCU requires the
ArduinoJsonlibrary (v7.2+). Be aware that serializing complex JSON objects on an ATmega328P will consume significant RAM. On the Portenta H7 or ESP32-S3, this overhead is negligible.
For those setting up their edge nodes, the Grafana Labs Getting Started Guide provides excellent primers on configuring MQTT data sources and InfluxDB flux queries.
Critical Failure Modes & Troubleshooting Data Dropouts
Even with perfect software compatibility, hardware-level bottlenecks frequently ruin arduino data visualization projects. Here are the most common failure modes and their engineering solutions:
1. USB-CDC Latency and Buffer Bloat
Modern boards like the ESP32-S3 and Raspberry Pi Pico (RP2040) use native USB-CDC rather than a dedicated UART-to-USB bridge chip (like the ATmega16U2 on the Uno R3). Native USB stacks often buffer data to optimize bus transactions, which can introduce 10ms to 50ms of latency in your visualization plots.
The Fix: Force a USB flush after critical data packets. On ESP32 Arduino core v3.x, call Serial.flush() immediately after your print statements to push the CDC buffer to the host immediately, ensuring real-time plotter response.
2. Heap Fragmentation from String Concatenation
Using the Arduino String class to build CSV payloads (e.g., String payload = String(temp) + "," + String(humidity);) causes dynamic memory allocation on every loop iteration. On boards with 2KB of SRAM (Uno R3), this leads to heap fragmentation and eventual MCU crashes, resulting in the serial port disconnecting from your visualization software.
The Fix: Use static character arrays and snprintf.
char buffer[64];
snprintf(buffer, sizeof(buffer), "%.2f,%.2f\n", temp, humidity);
Serial.print(buffer);
3. Baud Rate Clock Division Errors
If your Python script or MegunoLink instance is receiving garbled text or dropped packets, verify your baud rate. The ATmega328P running at 16MHz cannot perfectly divide its clock to achieve 115200 baud (it results in a -2.1% error). While usually tolerable, long cables or noisy environments will cause bit-flips.
The Fix: Drop the baud rate to 76800 or 57600 for AVR boards in noisy industrial environments, or upgrade to an ARM Cortex board (Uno R4, Portenta) which features fractional baud rate generators capable of exact timing.
Expert Verdict: Matching Your Project to the Right Stack
Selecting the right arduino data visualization tool is not about finding the "best" software, but the most compatible stack for your specific hardware and project scope.
- For quick, local debugging on any board: Stick to the Arduino IDE Serial Plotter. It requires zero setup and works universally.
- For cross-platform data science and high-speed logging: Build a custom Python/PySerial pipeline. It offers unlimited flexibility but requires coding expertise.
- For professional Windows-based field testing: Invest in MegunoLink. The $49.99 license pays for itself in time saved on UI development and automated logging.
- For remote, wireless IoT fleets: Deploy Grafana and InfluxDB via MQTT. Ensure you are using network-capable boards like the ESP32-S3 or Portenta H7 to handle the JSON and TLS overhead.
By respecting the memory limits, UART architectures, and network capabilities of your chosen microcontroller, you can build resilient, high-fidelity visualization pipelines that scale from the workbench to the cloud.
Frequently Asked Questions (FAQ)
Can I visualize data from an Arduino Uno R3 wirelessly?
Not natively. The Uno R3 lacks onboard WiFi or Bluetooth. You must either attach an ESP-01 WiFi module via a secondary hardware serial port (using AT commands) or upgrade to the Arduino Uno R4 WiFi, which features an integrated ESP32-S3 coprocessor for seamless cloud visualization compatibility.
Why does my serial plotter freeze when I unplug a sensor?
If your code uses blocking I2C or SPI read functions (like Wire.requestFrom() without timeouts), a disconnected sensor will cause the MCU to hang indefinitely on the I2C bus. The serial buffer stops updating, and the plotter appears frozen. Always implement I2C timeout watchdogs in your sensor polling routines.