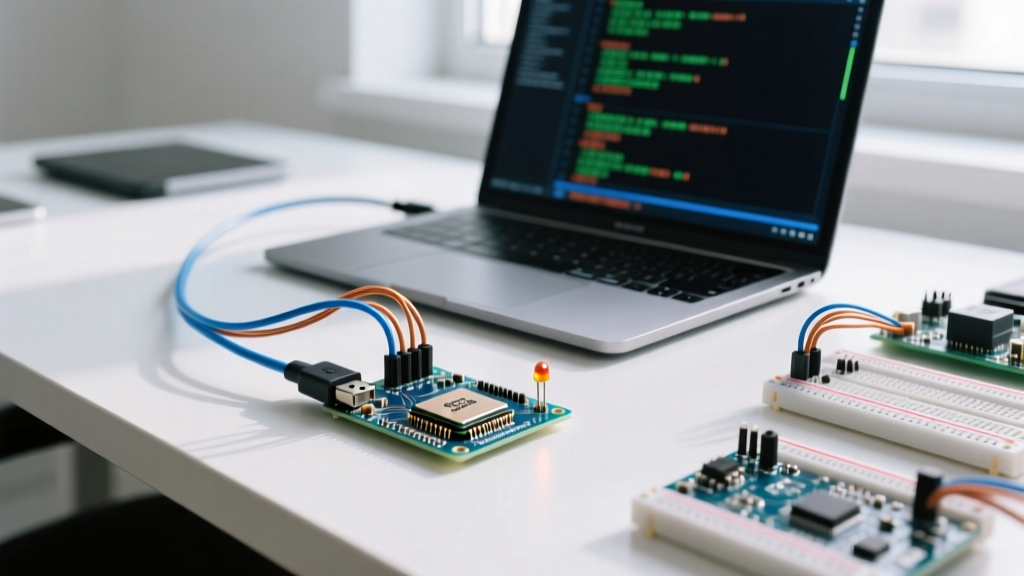

When your ESP32 halts execution and spits out a wall of hexadecimal memory addresses, the ESP32 crash decoder is your primary diagnostic tool. The decoder translates raw RTOS panic backtraces into readable C++ file names and line numbers, turning an opaque Guru Meditation Error into an actionable fix. Whether you are dealing with stack overflows, null pointer dereferences, or watchdog timeouts, decoding the trace is the only reliable way to find the exact instruction that caused the fault.
This guide targets the ESP32-DevKitC V4 (ESP32-WROOM-32E, 38-pin) running the Arduino-ESP32 core. We will build a sensor circuit with a deliberate memory fault, trigger a panic, and use the decoder to pinpoint the failure.
The Anatomy of an ESP32 Panic Dump
Before you can decode a crash, you need to understand what the ESP32 is telling you. When the FreeRTOS kernel detects an unrecoverable fault, it halts the CPU and prints a panic handler message to the UART serial console. The most common fatal error string looks like this:
Guru Meditation Error: Core 1 panic'ed (LoadProhibited). Exception was unhandled.
The keyword in the parentheses is the Exception Cause. The ESP32 Xtensa LX6 architecture defines specific hardware exception codes. Knowing the cause narrows your debugging scope immediately. Below is the data-dense reference table for the most common exceptions you will encounter in the wild.
| Cause Code | Exception Name | Typical Trigger in C/C++ | Fix Strategy |
|---|---|---|---|
| 0 | IllegalInstruction | Executing data as code; corrupted function pointer. | Check function pointer initialization and memory alignment. |
| 6 | IntegerDivideByZero | Dividing by an uninitialized or zero-valued variable. | Add conditional checks before division operations. |
| 12 | InstructionFetchProhibited | Jumping to a null or unmapped memory address. | Verify callbacks and interrupt service routine (ISR) pointers. |
| 13 | LoadProhibited | Reading from a null pointer or out-of-bounds array. | Check pointer allocation and array index limits. |
| 15 | StoreProhibited | Writing to a null pointer, read-only flash, or protected RAM. | Ensure target memory is writable and properly allocated. |
| 20 | InstructionFetchError | Cache miss or corrupted instruction pipeline. | Usually a hardware brownout or severe power supply ripple. |
Hardware and Pin Mapping for the Test Build
To demonstrate the crash decoder, we need a working circuit that we can intentionally break. We will interface an I2C environmental sensor. Power integrity is critical here; many "random" ESP32 crashes are actually brownouts caused by Wi-Fi RF transmission spikes drawing >300mA瞬间.
Parts List
- Microcontroller: ESP32-DevKitC V4 (38-pin, ESP32-WROOM-32E module)
- Sensor: Adafruit BME280 I2C Breakout (Product ID 2652)
- Capacitor: 100µF Electrolytic (16V rated, placed across 3V3 and GND)
- Resistors: 2x 4.7kΩ (I2C pull-ups, if breakout lacks them)
Pin Mapping Table
| ESP32 GPIO | Function | BME280 Pin | Notes |
|---|---|---|---|
| 3V3 | Power | VIN | Do NOT use 5V pin for 3.3V logic sensors. |
| GND | Ground | GND | Common ground required. |
| GPIO 21 | I2C SDA | SDA | Default hardware I2C SDA on ESP32. |
| GPIO 22 | I2C SCL | SCL | Default hardware I2C SCL on ESP32. |
Safety & Hardware Note: Always place the 100µF capacitor as close to the ESP32 module's 3V3 and GND pins as physically possible. The ESP32's internal LDO and the AMS1117 on the DevKit board can struggle with the microsecond current spikes during Wi-Fi calibration, leading to silent memory corruption that mimics software bugs.
Compilable Code: Triggering and Handling Faults
The following Arduino sketch targets the ESP32-DevKitC V4. It initializes the I2C bus, reads the BME280 sensor, and includes standard error handling for I2C timeouts. However, to demonstrate the crash decoder, it contains a deliberate logic flaw: an array out-of-bounds write that will trigger a StoreProhibited or LoadProhibited panic once the buffer fills.
#include <Wire.h>
#include <Adafruit_BME280.h>

// --- Pin Definitions (ESP32-DevKitC V4) ---
#define PIN_I2C_SDA 21
#define PIN_I2C_SCL 22
#define PIN_STATUS_LED 2 // Built-in LED on most DevKit V4 boards

// --- Constants ---
#define SEALEVELPRESSURE_HPA (1013.25)
#define HISTORY_BUFFER_SIZE 10

Adafruit_BME280 bme;
float tempHistory[HISTORY_BUFFER_SIZE];
int historyIndex = 0;

void setup() {
  Serial.begin(115200);
  delay(1000); // Allow serial port to stabilize
  Serial.println("ESP32 Crash Decoder Test Build");

  pinMode(PIN_STATUS_LED, OUTPUT);
  digitalWrite(PIN_STATUS_LED, LOW);

  // Initialize I2C with explicit pins and 400kHz fast mode
  Wire.begin(PIN_I2C_SDA, PIN_I2C_SCL, 400000);

  // Error handling for sensor initialization
  if (!bme.begin(0x77, &Wire)) {
    Serial.println("[ERROR] Could not find a valid BME280 sensor, check wiring!");
    // Blink LED rapidly to indicate hardware fault without crashing
    while (1) {
      digitalWrite(PIN_STATUS_LED, !digitalRead(PIN_STATUS_LED));
      delay(100);
    }
  }

  Serial.println("BME280 initialized successfully.");
}

void loop() {
  // Read sensor data
  float temperature = bme.readTemperature();
  float humidity = bme.readHumidity();

  // Basic sanity check for I2C read errors (returns NaN on failure)
  if (isnan(temperature) || isnan(humidity)) {
    Serial.println("[WARN] Sensor read failed, skipping history log.");
    delay(2000);
    return;
  }

  Serial.printf("Temp: %.2f C | Humidity: %.2f %%\n", temperature, humidity);

  // --- DELIBERATE BUG FOR DECODER DEMONSTRATION ---
  // We fail to reset historyIndex, causing an out-of-bounds memory write
  // when historyIndex >= HISTORY_BUFFER_SIZE.
  tempHistory[historyIndex] = temperature;
  historyIndex++;

  digitalWrite(PIN_STATUS_LED, HIGH);
  delay(500);
  digitalWrite(PIN_STATUS_LED, LOW);
  delay(500);
}
Upload this code via the Arduino IDE or PlatformIO. After about 5 seconds (10 successful loops), the ESP32 will halt and dump a backtrace to the serial monitor.
Decoding the Trace: Step-by-Step Troubleshooting
When the crash occurs, your serial monitor will output the exact error string: Guru Meditation Error: Core 1 panic'ed (LoadProhibited). Exception was unhandled. followed by a register dump and a Backtrace: line full of hex addresses like 0x400d1234:0x3ffb5678.
To translate these addresses, you need the ESP Exception Decoder plugin for the Arduino IDE, or the native monitor filter if you use PlatformIO. In PlatformIO, simply add monitor_filters = esp32_exception_decoder to your platformio.ini file, and it will decode the trace automatically in real-time (PlatformIO Monitor Docs).
The First Three Things to Check When It Fails
Once the decoder points you to a specific line of C++ code, do not just stare at the line. Evaluate the system state using this ranked checklist:
- Power Supply Brownout & Decoupling: Even if the decoder points to a software line, a voltage droop on the 3.3V rail can cause the CPU to misread an instruction or corrupt a pointer right before execution. Measure the 3.3V rail with an oscilloscope during Wi-Fi transmission. If you see dips below 3.0V, add bulk capacitance (100µF+) and high-frequency ceramic decoupling (100nF) directly at the module pins.
- Stack High Water Mark: If the crash happens inside a FreeRTOS task, you likely blew past your allocated stack size. Use
uxTaskGetStackHighWaterMark(NULL)in your loop to see how many bytes of stack are left. If it returns a number close to zero (e.g., < 100 bytes), increase your task stack size inxTaskCreatePinnedToCore. - Pointer Initialization & Array Bounds: As demonstrated in our code, writing past the end of an array overwrites adjacent memory. If that adjacent memory holds a function pointer or a FreeRTOS control block, the CPU will attempt to execute garbage data, resulting in an InstructionFetchProhibited or LoadProhibited panic on the next context switch.
For deeper architectural faults, consult the official Espressif Fatal Errors Guide, which details how the panic handler interacts with the hardware watchdog and JTAG interfaces.
Extending and Simplifying the Build
Depending on your project requirements, you may need to scale this debugging approach up for production firmware or strip it down for rapid prototyping.
How to Simplify
If you are struggling with multi-core race conditions and task stack overflows, simplify by abandoning FreeRTOS. Remove all xTaskCreate calls and run your entire application sequentially inside the default loop() function on Core 1. This eliminates inter-process communication bugs, mutex deadlocks, and core-affinity panics, making the crash decoder output much easier to read since there is only one active stack.
How to Extend for Production
For deployed IoT nodes where you cannot physically connect a USB cable to read the serial panic dump, extend your build by enabling Core Dump to Flash.
In the ESP-IDF or PlatformIO environment, configure your sdkconfig or build_flags to include:
-D CONFIG_ESP_COREDUMP_ENABLE_TO_FLASH=y
-D CONFIG_ESP_COREDUMP_DATA_FORMAT_ELF=y
When the ESP32 crashes in the field, it will write the entire CPU state, registers, and RAM contents to a reserved partition in the SPI flash. On the next reboot, your firmware can read this partition and transmit the core dump over MQTT or Wi-Fi to a cloud server, where you can run the ESP32 crash decoder offline and diagnose the field failure without needing physical access to the device.