The Anatomy of an ESP32 Panic: What is a Crash Decoder?
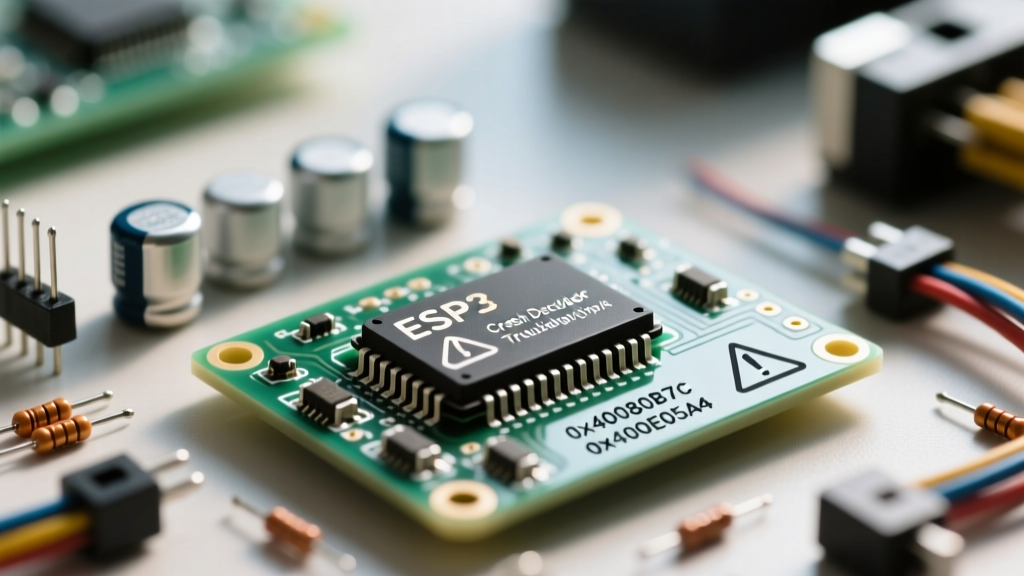
Every embedded developer working with Espressif chips has encountered the dreaded "Guru Meditation Error." When the ESP32 encounters an unrecoverable fault—such as an illegal memory access or a divide-by-zero operation—the FreeRTOS kernel triggers a panic. The serial monitor is immediately flooded with a cryptic wall of hexadecimal addresses, register dumps, and backtraces. Without an ESP32 crash decoder, this output is virtually useless for debugging.
A crash decoder translates these raw memory addresses (the Program Counter, or PC) back into human-readable C++ function names, source file names, and exact line numbers. This process relies on the .elf (Executable and Linkable Format) file generated during compilation, which contains the DWARF debugging symbols mapping machine code to your source code.
In this comprehensive troubleshooting guide, we will explore how to configure your environment for automatic decoding, interpret the Xtensa exception codes, and systematically fix the most common ESP32 crash scenarios.
Setting Up Your ESP32 Exception Decoder Environment
Historically, developers using Arduino IDE 1.8.x had to rely on third-party Java tools like the "ESP Exception Decoder" plugin. Today, modern toolchains handle this natively, provided your environment is configured correctly.
Arduino IDE 2.x Native Backtrace
If you are using Arduino IDE 2.x or later, the IDE includes a built-in symbol resolver. When a crash occurs, the serial monitor automatically intercepts the hex backtrace and queries the compiled .elf file. To ensure this works:
- Ensure Debug Level is set to at least "Core" or "Verbose" under the Tools menu.
- Do not close the IDE or switch boards immediately after a crash; the IDE needs the temporary build directory intact to resolve the symbols.
PlatformIO and ESP-IDF Monitor
For professional workflows using PlatformIO, the crash decoder is integrated directly into the serial monitor via Python-based filters. To enable it, open your platformio.ini file and add the monitor filter:
[env:esp32dev]
platform = espressif32
board = esp32dev
framework = arduino
monitor_speed = 115200
monitor_filters = esp32_exception_decoder, time
This tells the PlatformIO Device Monitor to automatically pipe any detected panic blocks through the xtensa-esp32-elf-addr2line tool, outputting clean file paths and line numbers directly to your terminal.
Decoding the "Guru Meditation Error" Backtrace
Before fixing the code, you must understand the crash log. Below is a typical raw panic output from an ESP32-WROOM-32 module:
Guru Meditation Error: Core  1 panic'ed (LoadProhibited). Exception was unhandled.

Core 1 register dump:

PC      : 0x400d1a2b  PS      : 0x00060030  A0      : 0x800d1b1c  A1      : 0x3ffb1f00

A2      : 0x00000000  A3      : 0x00000001  A4      : 0x00000001  A5      : 0x3ffb1e60

EXCVADDR: 0x00000010  LBEG    : 0x4000c46c  LEND    : 0x4000c477  LCOUNT  : 0x00000000


Backtrace: 0x400d1a2b:0x3ffb1f00 0x400d1b19:0x3ffb1f20 0x4008a9b5:0x3ffb1f40
Key Registers to Watch
- PC (Program Counter): The exact memory address of the instruction that caused the crash.
- EXCVADDR (Exception Virtual Address): The memory address the CPU was trying to read from or write to when the fault occurred. If this is a very low number (e.g.,
0x00000010), it almost always indicates a Null Pointer Dereference (trying to access a struct member via a null pointer). - Backtrace: A sequence of
PC:SP(Program Counter : Stack Pointer) pairs showing the call stack leading up to the crash.
Common Xtensa Exception Codes
The text inside the parentheses (e.g., LoadProhibited) is the exception reason. The Espressif Fatal Errors Documentation outlines these in detail, but here is a practical cheat sheet for makers:
| Exception Name | Code | Typical Cause & Fix Strategy |
|---|---|---|
| IllegalInstruction | 0 | Corrupted flash memory or executing data as code. Reflash the firmware using a lower baud rate. |
| IntegerDivideByZero | 6 | Division by an uninitialized or zero-value variable. Add boundary checks before math operations. |
| LoadProhibited | 13 | Reading from unmapped/protected memory. Usually a null pointer or an out-of-bounds array read. |
| StoreProhibited | 15 | Writing to read-only memory (like flash) or a null pointer. Check const pointers and buffer limits. |
| LoadStoreAlignment | 9 | Attempting to read/write a 32-bit word from an address not divisible by 4. Use memcpy instead of direct casting. |
Top 4 ESP32 Crash Scenarios and How to Fix Them
1. Stack Smashing and Deep Recursion
Unlike standard Arduino AVR boards, the ESP32 runs FreeRTOS. Every task created via xTaskCreate or xTaskCreatePinnedToCore is allocated a specific stack size in RAM. If you declare large local arrays (e.g., char buffer[4096];) or use deep recursive functions, you will exceed the task's stack boundary, resulting in a Stack Smashing panic or a LoadProhibited crash as the stack pointer bleeds into unmapped memory.
The Fix: Move large buffers to the heap using malloc() or global scope, or increase the task stack size. For standard Arduino loop() tasks, the default stack is usually 8192 bytes. Avoid heavy String concatenations inside the loop.
2. Task Watchdog Timer (TWDT) Trigger
If your serial monitor outputs Task watchdog got triggered, the ESP32 isn't crashing due to a memory fault, but because a high-priority task (often the IDLE task on Core 0 or Core 1) was starved of CPU time. This happens when you use blocking code like while(1) or lengthy delay() calls without yielding to the RTOS scheduler.
The Fix: Replace delay(1000) with vTaskDelay(1000 / portTICK_PERIOD_MS). If you must use a tight polling loop, insert yield() or taskYIELD() to allow the Watchdog and Wi-Fi/Bluetooth stacks to breathe.
3. Heap Corruption and Memory Leaks
The ESP32 has roughly 320KB of usable SRAM. Frequent allocation and deallocation of memory (common when parsing JSON with ArduinoJson or handling HTTP payloads) leads to heap fragmentation. Eventually, malloc() fails, returning a null pointer. If your code doesn't check for this null pointer and attempts to write to it, a StoreProhibited crash follows.
The Fix: Implement heap monitoring. Use ESP.getFreeHeap() and ESP.getMinFreeHeap() to track memory watermarks. To catch corruption early in development, enable heap poisoning in the ESP-IDF menuconfig or add heap_caps_check_integrity_all(true); inside your loop() to force a panic the exact moment memory is corrupted, rather than later when the corrupted pointer is used.
4. Null Pointer Dereference in Custom Structs
A classic EXCVADDR: 0x00000000 or 0x00000010 error. This occurs when you initialize a pointer to a custom struct or class but forget to allocate memory for it before accessing its members.
MySensor *sensor;
sensor->readTemperature(); // CRASH: sensor is null!
The Fix: Always validate pointers before dereferencing, or prefer stack-allocated objects (e.g., MySensor sensor;) over pointers unless dynamic allocation is strictly necessary.
Advanced Debugging: Using Core Dumps via Flash
For field-deployed ESP32 devices where you cannot connect a serial monitor, you can configure the ESP32 to save a Core Dump to a dedicated flash partition upon crashing. This captures the exact state of RAM and CPU registers at the moment of death.
To enable this, you must create a custom partition table CSV file that includes a coredump partition:
# Name,   Type, SubType, Offset,  Size
coredump, data, coredump,,        64K
Upon retrieving the device, you can use the esp-coredump tool provided by Espressif to extract the dump and load it into GDB (GNU Debugger), allowing you to inspect local variables and the exact state of the heap post-mortem. This is the ultimate application of the ESP32 crash decoder ecosystem for enterprise IoT deployments.
Summary Checklist for Stable ESP32 Firmware
Before pushing your firmware to production, run through this diagnostic checklist to minimize unhandled exceptions:
- Enable Decoder: Ensure PlatformIO or Arduino IDE 2.x backtrace resolution is active.
- Check Task Stacks: Use
uxTaskGetStackHighWaterMark(NULL)to verify your loop task has sufficient headroom (aim for at least 1000 bytes free). - Validate Pointers: Never assume
malloc(),WiFiClient, or file system handles succeeded. - Avoid Blocking Code: Yield to the FreeRTOS scheduler in all continuous loops.
- Monitor the Heap: Log
ESP.getFreeHeap()periodically to catch slow memory leaks before they trigger a null-pointer panic.
By mastering the ESP32 crash decoder and understanding the underlying Xtensa architecture, you transform cryptic panics into actionable debugging data, ensuring your Arduino ESP32 projects remain robust and reliable in the field.