The Anatomy of a High-Performance Arduino Code Tester
When most makers hear the term arduino code tester, they picture a simple serial monitor script that prints "PASS" or "FAIL." However, in professional embedded engineering, a true code tester designed for performance optimization is a hybrid system. It combines software-based unit testing frameworks with Hardware-in-the-Loop (HIL) execution profiling. As of 2026, with dual-core ESP32-S3 and RP2350 microcontrollers pushing the boundaries of DIY electronics, relying solely on Serial.print(micros()) to measure code execution is no longer viable. Serial communication introduces massive latency, masking the true microsecond-level bottlenecks in your Interrupt Service Routines (ISRs) and communication protocols.
To genuinely optimize your sketches, you must build an arduino code tester that evaluates three critical vectors: logic correctness, execution latency, and memory footprint. This guide details how to construct a professional-grade testing rig using industry-standard frameworks and logic analyzers.
The Software Layer: Choosing the Right Testing Framework
Before you can optimize performance, you must ensure your logic is bulletproof. Refactoring code for speed often introduces subtle bugs. Embedding a testing framework directly into your Arduino IDE workflow allows you to run assertions on your DSP algorithms, PID controllers, and state machines.
Unity vs. AUnit: A Technical Comparison
The two dominant frameworks in the embedded C/C++ space are ThrowTheSwitch Unity and AUnit. While AUnit is built specifically with Arduino's C++ environment in mind, Unity remains the industry standard for embedded C due to its minimal memory overhead.
| Feature | Unity (ThrowTheSwitch) | AUnit | ArduinoUnit (Legacy) |
|---|---|---|---|
| Language Base | ANSI C (Highly Portable) | C++ (Arduino Specific) | C++ (Arduino Specific) |
| Flash Overhead | ~2.5 KB (with assertions) | ~4.8 KB (uses C++ streams) | ~3.2 KB |
| SRAM Overhead | Minimal (No dynamic allocation) | High (String class usage) | Moderate |
| CI/CD Integration | Excellent (Ceedling support) | Poor (Requires hardware) | Poor |
| Float Assertions | TEST_ASSERT_FLOAT_WITHIN |
assertNear |
Limited |
Expert Insight: If you are testing code on an ATmega328P with only 2KB of SRAM, avoid AUnit. Its reliance on the Arduino String class for test output generation causes severe heap fragmentation. Unity relies on standard C macros and static buffers, making it the superior choice for memory-constrained performance optimization.
Hardware-in-the-Loop (HIL) Execution Profiling
Software assertions verify what your code does, but they cannot accurately measure how fast it does it. To build a true performance-focused arduino code tester, you must implement hardware-level execution profiling.
The GPIO Toggle Trick for Microsecond Profiling
Attempting to time an ISR using micros() and printing the result via Serial is a fundamental mistake. A 115200 baud Serial print takes roughly 1 millisecond to execute—completely dwarfing the 5-microsecond ISR you are trying to measure.
Instead, use direct port manipulation to toggle a digital pin at the entry and exit points of your critical code block. On a 16MHz AVR architecture, a standard digitalWrite() takes approximately 50 clock cycles (3.125µs). Direct port manipulation takes exactly 2 clock cycles (125ns).
// Entry point of ISR or critical function
PORTD |= (1 << PD2);  // Set Pin D2 HIGH (125ns)

// ... Your optimized DSP or control logic here ...

// Exit point
PORTD &= ~(1 << PD2); // Set Pin D2 LOW (125ns)
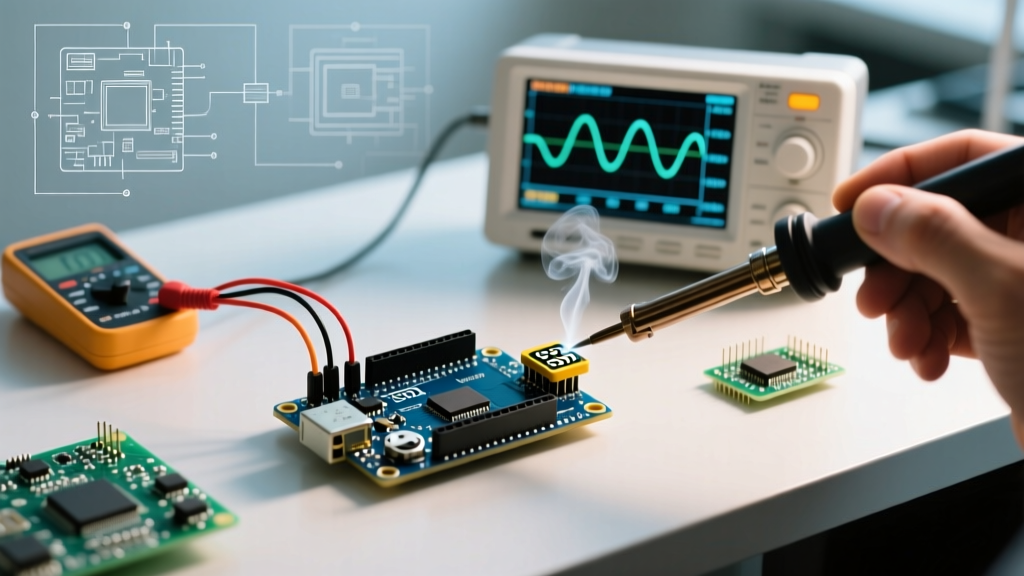
By connecting Pin D2 to a logic analyzer, you transform your hardware into a high-precision arduino code tester. The width of the resulting pulse on the analyzer's timeline represents the exact execution time of your code, completely free from software profiling overhead.
Selecting the Right Logic Analyzer for HIL Testing
To capture these nanosecond-level pulses and decode communication protocols simultaneously, you need a capable logic analyzer. Here is how the top 2026 options compare for embedded profiling:
- Kingst LA2016 (~$120): The best budget option. Features 16 channels at 200MHz sampling. Adequate for capturing I2C/SPI timing and GPIO toggle pulses, but its 256MB memory depth limits long-duration capture sessions.
- DSLogic Plus (~$160): Excellent for protocol decoding. Its FPGA-based triggering allows you to capture GPIO execution pulses only when a specific I2C address is polled, making it ideal for isolating performance bottlenecks in complex sensor networks.
- Saleae Logic Pro 8 ($499): The industry standard. Offers 8 digital and 8 analog channels. The analog channels are crucial for measuring power spikes during heavy computational loads, correlating code execution with actual current draw.
Step-by-Step: Profiling I2C Bottlenecks and Clock Stretching
A common performance killer in Arduino projects is I2C bus locking. Software mocks in your unit tester will pass I2C tests instantly, but real-world sensors often utilize "clock stretching," where the slave device holds the SCL line low to buy processing time. If your code doesn't handle this, your main loop stalls.
- Wire the HIL Rig: Connect your Arduino SDA/SCL lines to the logic analyzer. Connect the GPIO profiling pin (D2) to a third channel.
- Inject the Profiling Toggle: Wrap your
Wire.requestFrom()call in the GPIO port manipulation code shown above. - Configure the Analyzer: Set the I2C protocol decoder to 400kHz (Fast Mode). Set an edge trigger on the SCL line.
- Capture and Analyze: Run the test suite. Measure the time between the GPIO pin going HIGH and the I2C Stop condition. If the GPIO pulse is 500µs, but the I2C decoder shows 400µs of SCL being held LOW, you have identified a hardware clock-stretching bottleneck that software testing completely missed.
Edge Cases: When Your Tester Lies to You
Even with a robust arduino code tester setup, embedded systems present unique edge cases that can invalidate your performance metrics. Watch out for these specific failure modes:
1. Interrupt Masking During Serial Output
If your test harness uses Serial.print() to output Unity test results, the Arduino core disables interrupts while the TX buffer is filled. If an ISR fires during this window, your measured ISR latency will be artificially inflated. Always buffer test results in SRAM and dump them only after the performance-critical profiling phase is complete.
2. Atomic Block Violations
When testing 16-bit or 32-bit variables updated by an ISR on an 8-bit AVR, reading the variable in your test assertion requires multiple clock cycles. If the ISR fires mid-read, your tester will record corrupted data. You must wrap your test reads in atomic blocks using AVR Libc Atomic Operations.
#include <util/atomic.h>

volatile uint32_t isr_pulse_count;
uint32_t local_copy;

ATOMIC_BLOCK(ATOMIC_RESTORESTATE) {
    local_copy = isr_pulse_count;
}
TEST_ASSERT_EQUAL_UINT32(expected_count, local_copy);
Memory Footprint Optimization Matrix
Performance optimization isn't just about speed; it's about resource utilization. As detailed in the Official Arduino Memory Guide, exhausting SRAM leads to unpredictable reboots. When integrating your testing framework, you must account for its memory tax.
| Testing Component | Flash Cost | SRAM Cost | Optimization Strategy |
|---|---|---|---|
| Unity Core | ~1.8 KB | ~120 Bytes | Strip unused float/math assertions via unity_config.h |
| Test Strings (Literals) | Varies | High (if not in PROGMEM) | Use F() macro or Unity's built-in PROGMEM support |
| Mock Objects (I2C/SPI) | ~3.5 KB | ~250 Bytes | Use conditional compilation (#ifdef TEST_ENV) to exclude mocks in production builds |
Frequently Asked Questions
Can I use an Arduino code tester for ESP32 and RP2040 projects?
Yes, but the profiling methodology changes. The ESP32 and RP2040 feature 32-bit ARM/Xtensa cores running at 133MHz to 240MHz. At these speeds, a GPIO toggle might only take 10-20 nanoseconds, which requires a logic analyzer with at least a 500MHz sampling rate (like the Saleae Logic Pro 16) to capture accurately. Furthermore, you must account for cache misses and RTOS context switching when measuring execution time on these platforms.
How do I automate my arduino code tester in a CI/CD pipeline?
By using a tool like Ceedling alongside the Unity framework, you can compile your Arduino code for a host PC (x86/ARM) and run the logic tests natively in GitHub Actions or GitLab CI. For HIL performance tests, you can use a Raspberry Pi running PlatformIO and pytest to flash the Arduino, trigger the tests via Serial, and parse the logic analyzer CSV outputs automatically.
Does compiler optimization affect my test results?
Absolutely. The Arduino IDE defaults to -Os (optimize for size). If you are testing execution speed, you must modify your platform.txt or use PlatformIO to change the flag to -O3 (optimize for speed) or -Ofast. Your arduino code tester will show drastically different GPIO pulse widths depending on this single compiler flag, often revealing that loop unrolling and inline functions reduce execution time by up to 40% at the cost of Flash memory.