
The Case for a Geospatial Smart Home Command Center
Most smart home dashboards are inherently binary. They tell you if a light is on, if a door is locked, or what the indoor thermostat is set to. However, as your IoT ecosystem expands beyond the walls of your house, binary states are no longer sufficient. Outdoor smart home devices—such as GPS-tracked robot mowers, distributed soil moisture sensors, weather stations, EV chargers, and automated gate motors—are inherently spatial. To truly understand and control your property's perimeter and exterior assets, you need a geospatial interface.
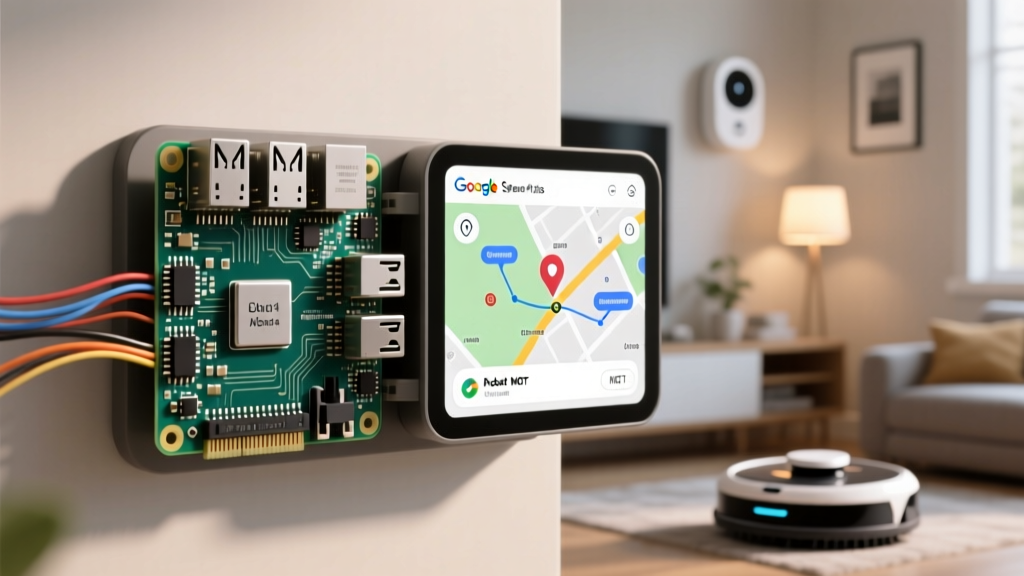
Integrating a Google Maps Raspberry Pi setup into your Home Assistant environment bridges the gap between physical geography and digital automation. By mounting a Raspberry Pi-driven touch dashboard in your kitchen or garage, you can visualize real-time telemetry overlaid on satellite imagery. This guide details how to architect a high-performance, WebGL-accelerated map dashboard that pulls live MQTT data from Home Assistant and renders it via the Google Maps JavaScript API.
Hardware BOM: Driving WebGL on a Budget
Rendering dynamic map tiles, satellite imagery, and real-time vector markers requires substantial GPU overhead. While older single-board computers struggle with WebGL map rendering, modern SBCs handle it beautifully. Below is the recommended Bill of Materials for a responsive, wall-mounted smart home map terminal.
| Component | Model / Specification | Approx. Price | Purpose |
|---|---|---|---|
| SBC | Raspberry Pi 5 (8GB RAM) | $80.00 | Core compute & WebGL rendering |
| Display | Elecrow 10.1" HDMI IPS Touchscreen | $135.00 | Capacitive touch interface for panning/zooming |
| Thermal | Raspberry Pi Active Cooler | $5.00 | Prevents thermal throttling during GPU loads |
| Storage | 64GB NVMe SSD via PCIe HAT | $45.00 | Fast OS boot and browser cache storage |
| Power | Official 27W USB-C PD Supply | $12.00 | Stable power for Pi 5 and display |
Architecting the Map: MQTT Meets the Google Maps JavaScript API
To build a truly dynamic dashboard, we avoid static embeds. Instead, we will host a lightweight Node.js application directly on the Raspberry Pi. This application serves the frontend HTML/JS and acts as a WebSocket bridge, subscribing to your Home Assistant MQTT broker. When a sensor updates its GPS coordinates or state in Home Assistant, the Pi pushes that data to the browser instantly, updating the map marker without refreshing the page or consuming excess API quota.
Step 1: Google Cloud Console & Billing Safeguards
Before writing any code, you must provision your API keys securely. The Google Maps JavaScript API is not free, but Google provides a recurring $200 monthly credit, which translates to roughly 28,500 free dynamic map loads per month—more than enough for a single smart home dashboard.
- Navigate to the Google Maps JavaScript API documentation and enable the API in your Google Cloud Console.
- Enable the Geocoding API if you plan to convert physical addresses (like 'Home' or 'Work') into coordinates for geofencing.
- Critical Security Step: Restrict your API key. Under 'Application Restrictions', select 'HTTP referrers' and limit it to your Pi's local IP (e.g.,
http://192.168.1.50:3000/*). Under 'API restrictions', limit the key strictly to the JavaScript and Geocoding APIs. - Set a hard quota alert in the Billing section to notify you if usage exceeds $5.00, preventing runaway loops from draining your account.
Step 2: The Raspberry Pi Node.js MQTT Bridge
On your Raspberry Pi, install Node.js and initialize a new project. You will need express, mqtt, and socket.io. This bridge listens to the Home Assistant MQTT integration and forwards spatial data to the frontend.
const express = require('express');
const mqtt = require('mqtt');
const http = require('http');
const { Server } = require('socket.io');

const app = express();
const server = http.createServer(app);
const io = new Server(server);

app.use(express.static('public'));

// Connect to Home Assistant Mosquitto Broker
const client = mqtt.connect('mqtt://192.168.1.100', {
  username: 'ha_user',
  password: 'secure_password'
});

client.on('connect', () => {
  // Subscribe to outdoor sensor and robot mower topics
  client.subscribe('smarthome/outdoor/+/location');
  client.subscribe('smarthome/mower/+/status');
});

client.on('message', (topic, message) => {
  const payload = JSON.parse(message.toString());
  // Broadcast to the dashboard frontend via WebSockets
  io.emit('sensor_update', { topic: topic, data: payload });
});

server.listen(3000, () => {
  console.log('Smart Home Map Dashboard running on port 3000');
});
In your frontend index.html, the Socket.io client listens for sensor_update events and uses the google.maps.Marker class to smoothly animate the marker to the new latitude and longitude coordinates.
Chromium Kiosk Optimization: Eliminating Map Stutter
The Raspberry Pi 5 features a significantly upgraded VideoCore VII GPU, but out-of-the-box Chromium configurations often default to software rendering for complex WebGL layers. If your Google Maps satellite view stutters at 15 FPS when panning, you need to force hardware acceleration.
First, edit your Raspberry Pi config.txt file to ensure the correct DRM/KMS overlay is active for the Pi 5:
# Add to /boot/firmware/config.txt
dtoverlay=vc4-kms-v3d-pi5
gpu_mem=256
Next, configure your Chromium kiosk launch script. Create a bash script at /home/pi/start-dashboard.sh with the following GPU-specific flags:
chromium-browser \
  --kiosk \
  --incognito \
  --disable-features=TranslateUI \
  --enable-accelerated-2d-canvas \
  --enable-gpu-rasterization \
  --use-gl=egl \
  --ignore-gpu-blacklist \
  http://localhost:3000
Using --use-gl=egl forces Chromium to utilize the Mesa EGL driver, which interfaces directly with the Pi's V3D DRM driver, resulting in buttery-smooth 60 FPS map panning and zooming, even with dozens of custom SVG markers rendered on screen.
Expert Insight: Never expose your Google Maps API key directly in a public-facing repository. Because this dashboard is hosted locally on your Pi and accessed via your LAN, the key is relatively safe, but always enforce HTTP referrer restrictions in the Google Cloud Console to ensure the key cannot be scraped and used on external domains.
Handling Geofence Triggers via Home Assistant Automations
The visual dashboard is only half the integration. The true power of a Google Maps Raspberry Pi setup lies in feeding that spatial awareness back into Home Assistant. By utilizing the Node.js bridge, you can also publish calculated distances back to MQTT.
For example, if your dashboard tracks the GPS coordinates of your EV, the Node.js server can use the Google Maps geometry.spherical.computeDistanceBetween method to calculate the exact distance from the car to your driveway gate. If the distance drops below 50 meters, the script publishes a payload to smarthome/gate/proximity. Home Assistant then triggers an automation to open the physical gate motor and turn on the driveway floodlights.
Low-Power Alternative: Static Maps API for Pi Zero 2 W
If you are deploying a smaller, localized dashboard (such as a 3.5-inch TFT screen next to the garden shed to show soil moisture zones), the Raspberry Pi 5 is overkill. The Raspberry Pi Zero 2 W lacks the RAM and GPU horsepower to render the dynamic JavaScript API smoothly.
Instead, leverage the Google Maps Static API. Write a lightweight Python script using the requests library to query the Static API endpoint every 5 minutes, appending your sensor coordinates as path parameters. The API returns a lightweight PNG image. You can display this image using a minimal framebuffer viewer like fbi or a lightweight Python Tkinter app. This approach consumes virtually zero GPU resources, keeps the Pi Zero running cool, and still provides an updated geospatial overview of your garden's IoT mesh network.
Final Thoughts on Geospatial Automation
Transitioning from a list-based smart home interface to a map-based spatial interface fundamentally changes how you interact with your property. By combining the compute power of the Raspberry Pi 5, the real-time messaging of MQTT, and the rich cartography of the Google Maps JavaScript API, you create a command center that doesn't just control your home—it understands its place in the physical world.