
The Foundation of Global Power: Understanding the Waveform
When electrical engineers, master electricians, and DIY enthusiasts evaluate power distribution, the fundamental building block they must understand is the alternating current sine wave. Unlike direct current (DC), which flows steadily in a single direction, alternating current (AC) periodically reverses direction. This reversal creates a distinct, mathematically predictable waveform known as a sine wave. Understanding the precise geometry, voltage metrics, and potential distortions of this waveform is not just an academic exercise; it is critical for accurate wire sizing, proper insulation selection, and the prevention of catastrophic dielectric breakdown in modern electrical systems.
In this comprehensive reference guide, we will dissect the anatomy of the AC sine wave, provide a crucial voltage reference chart for global systems, and explore how harmonic distortion impacts real-world wiring and component longevity.
The Electromagnetic Origin of the Sine Wave
To understand why the grid relies on a sinusoidal shape, we must look at how power is generated. According to Faraday’s Law of Induction, when a conductive coil rotates through a uniform magnetic field inside a generator, the induced electromotive force (EMF) varies continuously. As the coil moves parallel to the magnetic flux, voltage is zero. As it cuts perpendicularly through the flux, voltage reaches its maximum. This continuous rotational geometry naturally traces the mathematical sine function.
Because of this physical origin, the alternating current sine wave is the most efficient and natural way to transmit electromagnetic energy over long distances. Transformers, which are essential for stepping voltages up for transmission and down for residential use, rely entirely on the continuously changing magnetic flux provided by the smooth, continuous derivative of the sine wave to operate efficiently.
Defining the Metrics: Peak, Peak-to-Peak, and RMS
One of the most common points of failure in amateur electrical design is confusing the different voltage metrics of a sine wave. When you measure a standard US wall outlet with a multimeter and read 120V, you are not looking at the maximum voltage the wire insulation must withstand.
Root Mean Square (RMS) Voltage
The RMS value is the effective voltage. It represents the equivalent DC voltage that would produce the exact same heating effect (I²R losses) in a resistive load. When sizing wires for ampacity and calculating power consumption, engineers exclusively use RMS values. Standard multimeters measure and display RMS voltage.
Peak and Peak-to-Peak Voltage
While RMS dictates wire thickness and thermal limits, the Peak Voltage dictates insulation requirements. The insulation wrapping a conductor (such as THHN or XHHW) must be thick enough to withstand the absolute maximum voltage excursion of the wave without suffering dielectric breakdown. Peak-to-Peak voltage is simply the total voltage swing from the positive peak to the negative peak, a metric frequently used when analyzing waveforms on an oscilloscope.
Alternating Current Sine Wave Voltage Reference Chart
The following reference chart maps standard nominal system voltages to their actual peak and peak-to-peak values. This chart is essential for specifying surge protective devices (SPDs), capacitor banks, and high-voltage insulation ratings.
| Nominal System Voltage (RMS) | Peak Voltage (Vp) | Peak-to-Peak (Vp-p) | Typical Application & Region |
|---|---|---|---|
| 120V | 169.7V | 339.4V | US / Canada Residential Receptacles |
| 208V | 294.1V | 588.3V | US Light Commercial (3-Phase Wye) |
| 230V | 325.3V | 650.5V | EU / UK / Australia Residential |
| 277V | 391.7V | 783.4V | US Commercial Lighting (Phase-to-Neutral) |
| 400V | 565.7V | 1131.4V | EU Industrial (3-Phase Wye) |
| 480V | 678.8V | 1357.6V | US Heavy Industrial (3-Phase Delta/Wye) |
Essential Mathematical Formulas for Sine Wave Calculations
For field calculations and design verification, keep these fundamental trigonometric relationships handy. These assume a pure, undistorted alternating current sine wave:
- V_RMS to V_Peak: V_peak = V_rms × √2 (approx. V_rms × 1.414)
- V_Peak to V_RMS: V_rms = V_peak / √2 (approx. V_peak × 0.707)
- V_Average (Half Cycle): V_avg = V_peak × (2 / π) (approx. V_peak × 0.637)
- Instantaneous Voltage: v(t) = V_peak × sin(2πft + θ), where f is frequency in Hertz and θ is the phase angle.
- Form Factor: The ratio of RMS to Average value, which is always 1.11 for a pure sine wave.
For a deeper dive into the mathematical derivation of these AC waveforms, the All About Circuits AC Waveforms textbook chapter provides excellent foundational calculus and physics explanations.
The Threat of Harmonic Distortion (THD)
In a perfect world, the alternating current sine wave remains smooth and continuous. However, modern electrical environments are heavily polluted by non-linear loads. Devices such as Variable Frequency Drives (VFDs), LED drivers, switch-mode power supplies (SMPS), and computer servers do not draw current in a smooth sinusoidal manner. Instead, they draw current in abrupt, high-amplitude pulses at the peaks of the voltage waveform.
This non-linear drawing distorts the pure sine wave, introducing harmonic frequencies (multiples of the fundamental 50Hz or 60Hz frequency). For example, on a 60Hz system, the 3rd harmonic is 180Hz, the 5th is 300Hz, and so on.
Why Harmonics Matter for Wire Sizing
Harmonics create severe real-world problems for wiring infrastructure:
- Neutral Conductor Overheating: Triplen harmonics (3rd, 9th, 15th) do not cancel out in the neutral wire of a 3-phase system; they add together arithmetically. A neutral conductor can carry up to 200% of the phase current, leading to insulation melting and fires if the neutral was not sized larger than the phase conductors.
- Skin Effect Exacerbation: Higher frequency harmonics force current to travel only on the outer surface (skin) of the conductor. This effectively reduces the cross-sectional area of the wire, increasing AC resistance and causing excessive thermal buildup.
- Transformer Derating: Harmonic currents induce severe eddy current losses in transformer cores, requiring engineers to use K-rated transformers or heavily derate standard units.
According to IEEE Standard 519-2022, total harmonic distortion (THD) for voltage on general distribution systems should not exceed 5% to prevent equipment degradation, while current distortion limits vary based on the short-circuit ratio of the point of common coupling (PCC). Maintaining a pure alternating current sine wave is vital for system longevity.
For practical field strategies on identifying and mitigating these distortions, the Fluke Power Quality Guide on Harmonics offers indispensable diagnostic workflows.
Field Diagnostics and Troubleshooting the Waveform
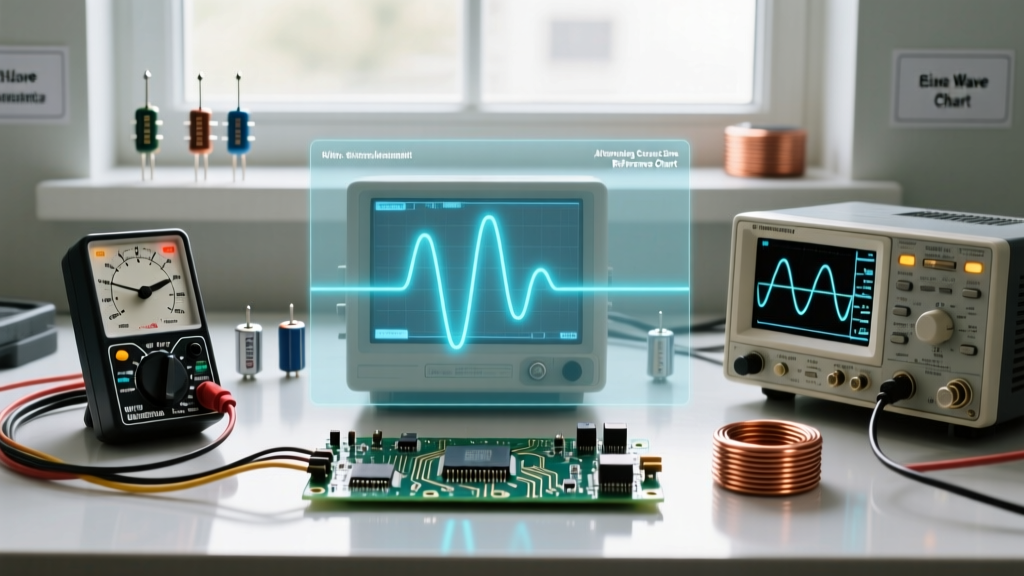
When troubleshooting power quality issues, a standard digital multimeter is insufficient. True-RMS multimeters will accurately measure the heating value of a distorted wave, but they cannot reveal the shape of the distortion. To properly analyze the alternating current sine wave, technicians must use specialized equipment.
Using an Oscilloscope
A handheld oscilloscope (such as the Fluke 190 ScopeMeter series) allows you to visually inspect the waveform. Look for 'flat-topping' on the voltage peaks, which indicates that the impedance of the wiring is causing voltage drops during the high-current pulses drawn by non-linear loads. Flat-topping reduces the effective DC bus voltage inside VFDs and SMPS, leading to premature capacitor failure.
Deploying a Power Quality Analyzer
For comprehensive analysis, a Power Quality Analyzer (like the Fluke 435-II) is required. These devices log data over time, providing a harmonic spectrum bar chart that identifies exactly which harmonic orders are polluting your sine wave. They also capture transient sags, swells, and inrush currents that occur during motor startups, which momentarily collapse the sine wave amplitude.
Conclusion: Respecting the Waveform
The alternating current sine wave is much more than a theoretical concept; it is the physical reality that dictates how electrical energy behaves in conductors, transformers, and loads. By understanding the critical difference between RMS and Peak voltages, utilizing accurate reference charts for insulation sizing, and actively monitoring for harmonic distortion, electrical professionals can design systems that are not only code-compliant but inherently robust. Whether you are sizing a simple 120V residential branch circuit or engineering a 480V industrial distribution bus, respecting the physics of the sine wave is the first step toward electrical safety and reliability.
For further reading on the physics of AC voltage and electromagnetic induction, the Georgia State University HyperPhysics portal remains a premier academic resource for electrical fundamentals.