Architectural Overview: The Giga R1 and Display Shield
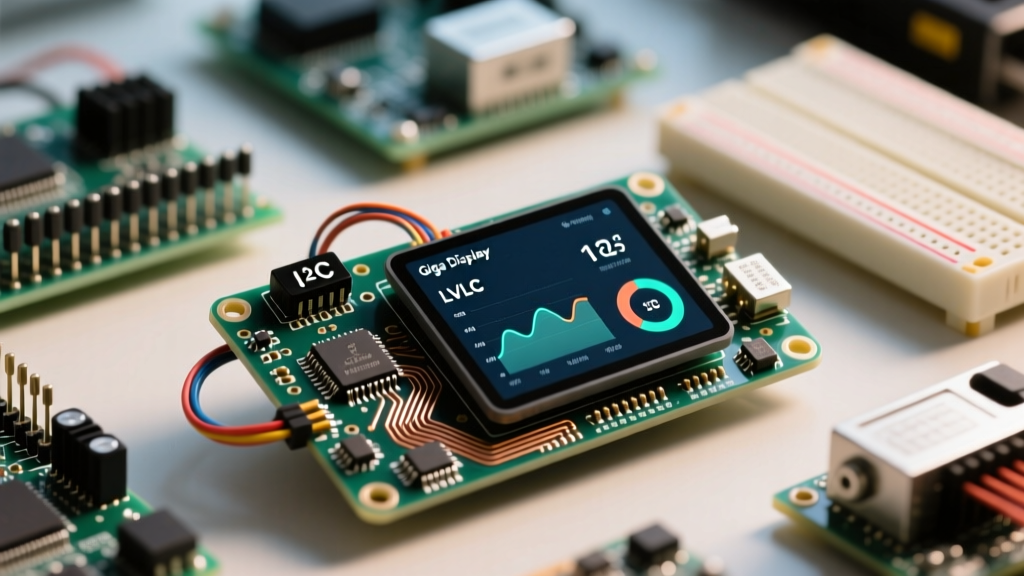
Integrating sensors with the Arduino Giga Display Shield transforms the already formidable Giga R1 WiFi into a standalone Human-Machine Interface (HMI). Unlike standard microcontroller setups that rely on serial monitors or tiny OLEDs, the Giga Display offers a 4-inch IPS capacitive touchscreen with a 480x480 resolution, driven by the ST7701S controller. However, building a robust sensor dashboard requires navigating the complex hardware architecture of the STM32H747XI dual-core microcontroller and managing high-speed peripheral buses.
The primary challenge in sensor integration is not merely reading data, but doing so without interrupting the display's refresh cycle or the capacitive touch controller's polling rate. The official Arduino Giga Display documentation outlines the physical connections, but real-world engineering demands a deeper understanding of bus contention, logic level translation, and memory allocation for graphical frame buffers.
Navigating I2C Bus Collisions and Sensor Routing
The most common failure mode when adding environmental sensors (like the BME280 or SCD40) to a Giga Display setup is I2C bus collision. The display shield utilizes the primary I2C bus to communicate with the Goodix GT911 capacitive touch controller, which typically resides at I2C address 0x5D or 0x14.
The Danger of Default Wire Pull-Ups
If you wire an I2C sensor directly to the default SDA/SCL pins (D20 and D21) alongside the display shield, you risk overloading the I2C pull-up resistors. The Giga Display shield features onboard 2.2kΩ pull-up resistors. Adding multiple sensor breakout boards, which often include their own 4.7kΩ pull-ups, lowers the equivalent parallel resistance. This can cause the I2C bus voltage to rise too slowly, resulting in missed touch interrupts or corrupted sensor telemetry.
Pro-Tip: Always use a logic analyzer or oscilloscope to verify the I2C rise times when chaining more than two devices on the Giga's primary bus. If rise times exceed 300ns, you must remove pull-up resistors from your sensor breakouts or switch to a dedicated bus.
Utilizing Wire1 and the Qwiic Ecosystem
To bypass primary bus contention, route your sensor array through Wire1 (pins D18 and D19). The Giga R1 WiFi also features an onboard Qwiic/STEMMA QT connector wired to a dedicated I2C bus, making it the ideal physical interface for chaining modern 3.3V digital sensors without the need for breadboards or manual pull-up calculations.
| Sensor Type | Recommended Bus | Pins / Interface | Notes |
|---|---|---|---|
| Capacitive Touch (GT911) | Primary I2C (Wire) | D20 (SDA), D21 (SCL) | Managed internally by GigaDisplay library |
| BME688 / SCD40 (Environmental) | Secondary I2C (Wire1) | D18 (SDA), D19 (SCL) or Qwiic | Prevents touch latency |
| INA219 (Current/Voltage) | Secondary I2C (Wire1) | D18 (SDA), D19 (SCL) | High-frequency polling safe |
| Analog Telemetry (e.g., NTC) | ADC | A0 - A11 | Use 16-bit ADC resolution via analogReadResolution(16) |
Dual-Core Sensor Polling: M7 vs M4 Architecture
The STM32H747XI features a 480MHz Cortex-M7 core and a 240MHz Cortex-M4 core. When building a sensor dashboard, blocking code is the enemy of a smooth UI. If you use a sensor that requires precise timing or blocking delays (such as the DHT22 or certain analog averaging routines), executing this on the M7 core will cause the LVGL (Light and Versatile Graphics Library) rendering loop to stutter.
The optimal architecture delegates sensor acquisition to the M4 core, while the M7 core handles the Arduino Giga Display rendering and network tasks. Using Arduino's RPC (Remote Procedure Call) library, the M4 core can poll an array of analog sensors, package the data into a struct, and pass it to the M7 core's memory space asynchronously.
Implementing RPC for Telemetry
By initializing RPC.begin() on both cores, you establish a shared memory bridge. The M4 core continuously reads a 4-20mA industrial pressure sensor via an external ADC, while the M7 core runs the lv_timer_handler() to update an lv_meter or lv_chart widget. This separation guarantees a locked 60FPS UI refresh rate on the display, regardless of sensor latency or I2C bus slowdowns.
Logic Level Translation: Protecting the 3.3V GPIOs
A critical hardware consideration is that the Arduino Giga R1 WiFi operates strictly at 3.3V logic. While some GPIO pins are documented as 5V tolerant, the I2C, SPI, and high-speed ADC pins are not. Connecting legacy 5V sensors (like standard HC-SR04 ultrasonic modules or 5V I2C multiplexers) directly to the Giga will degrade the silicon over time or cause immediate catastrophic failure.
For 5V sensor integration, you must employ a bidirectional logic level shifter, such as the TXS0108E or a dedicated BSS138 MOSFET-based breakout. Ensure the level shifter's OE (Output Enable) pin is tied to 3.3V, and route the sensor's 5V power from the Giga's dedicated 5V pin, which is sourced directly from the USB-C PD negotiation or the external VIN barrel jack.
Designing the LVGL Sensor Dashboard
Creating a professional dashboard on the 480x480 IPS panel requires leveraging the LVGL framework. The Arduino_H7_Video and Arduino_GigaDisplay_GFX libraries provide the hardware abstraction layer, but LVGL provides the widgets.
Widget Selection for High-Density Data
- lv_chart: Ideal for time-series sensor data (e.g., temperature over 24 hours). Configure the chart buffer to hold 120 data points and use a circular buffer update method to minimize RAM consumption on the M7 core.
- lv_meter: Perfect for analog gauge representations of voltage or pressure. Utilize the 16-bit ADC resolution of the Giga to map 0-65535 raw values directly to the meter's 0-100 degree scale for ultra-smooth needle animation.
- lv_label: Use monospaced fonts (like
lv_font_montserrat_14) for numerical telemetry to prevent UI jitter when numbers change from single to double digits.
Troubleshooting Common Display and Sensor Failures
When your sensor dashboard fails to render or touch becomes unresponsive, use this diagnostic framework:
1. The White Screen of Death (QSPI Flash Failure)
The Giga Display relies on the board's 16MB QSPI flash to store LVGL assets, fonts, and frame buffers. If your code compiles and uploads but the screen remains pure white, the M7 core has failed to mount the QSPI filesystem. This is often caused by uploading a sketch that crashes during the setup() phase before the display initialization sequence completes. Fix: Double-tap the reset button to enter bootloader mode, and perform a 'Burn Bootloader' via the Arduino IDE to reset the memory partitions.
2. Touch Unresponsiveness Under High Sensor Load
If the display renders correctly but touch inputs drop when sensors are actively polling, you are experiencing I2C bus starvation. The GT911 touch controller requires a high-priority I2C interrupt. If a sensor on the same bus is executing a heavy multi-byte read (like an SCD40 CO2 sensor), the touch interrupt is delayed. Fix: Move the heavy sensor to Wire1 or implement an I2C multiplexer (TCA9548A) with dedicated interrupt lines.
3. Thermal Throttling and Backlight Dimming
The Giga R1's dual-core processor and the display's LED backlight generate significant thermal mass. The shield includes a dedicated boost converter for the backlight. If your USB-C power supply cannot deliver a sustained 5V at 3A, the voltage rail will sag under the combined load of the Wi-Fi radio, the M7 core, and the backlight, causing the display to dim or the microcontroller to brownout. Always use a high-quality USB-C PD power supply rated for at least 18W when driving the full sensor and display stack.
Conclusion
Mastering sensor integration with the Arduino Giga Display requires moving beyond basic wiring diagrams. By strategically routing I2C sensors to secondary buses, leveraging the STM32H7's dual-core RPC architecture for non-blocking telemetry, and respecting 3.3V logic thresholds, you can build industrial-grade HMIs. The combination of high-resolution LVGL dashboards and robust peripheral management makes the Giga ecosystem a premier choice for advanced IoT and diagnostic tooling.