
Why Large Conductors Fail: Beyond the AWG Scale
When electrical systems scale beyond 4/0 AWG, the American Wire Gauge (AWG) system becomes mathematically cumbersome. Enter the MCM (or kcmil) designation, representing 'thousand circular mils.' For electrical troubleshooting professionals, an mcm wire size chart is not just a reference for new installations; it is a critical diagnostic tool. Large feeders—typically ranging from 250 MCM to 1000 MCM and beyond—are the arteries of commercial and industrial power distribution. When they fail, the consequences include catastrophic arc flashes, localized fires, and massive operational downtime.
Troubleshooting these massive conductors requires a deep understanding of their physical properties, thermal limits, and AC resistance characteristics. Unlike standard branch circuits, large MCM feeders are heavily influenced by skin effect, proximity effect, and complex termination physics. In this guide, we will explore how to leverage an mcm wire size chart to diagnose and resolve three of the most common high-amperage failure modes: termination overheating, parallel feeder imbalance, and severe voltage drop.
The Essential MCM Wire Size Chart for Diagnostics
Before diving into specific troubleshooting scenarios, we must establish our baseline data. The chart below details standard copper (Cu) conductor metrics based on XHHW-2/THHN insulation. Note that while the 90°C column is useful for derating calculations, the 75°C column almost always dictates the final termination ampacity per NEC 110.14(C), as most large lugs and breaker terminals are rated for 75°C.
| Size (MCM/kcmil) | Area (Circular Mils) | Approx. Diameter (in) | Ampacity 75°C Cu | Ampacity 90°C Cu | DC Resist. (Ω/kft @ 75°C) |
|---|---|---|---|---|---|
| 250 | 250,000 | 0.575 | 255A | 290A | 0.0535 |
| 350 | 350,000 | 0.681 | 310A | 350A | 0.0382 |
| 500 | 500,000 | 0.813 | 380A | 430A | 0.0267 |
| 750 | 750,000 | 0.998 | 475A | 535A | 0.0178 |
| 1000 | 1,000,000 | 1.150 | 545A | 615A | 0.0134 |
Data sourced from standard Southwire Ampacity Charts and NEC Table 310.15(B)(16). For AC resistance, multiply DC values by a skin-effect factor of approximately 1.02 to 1.05 for conductors 500 MCM and larger at 60Hz.
Troubleshooting Scenario 1: Unexplained Termination Overheating
The Symptom: A thermal imaging scan of a main distribution panel reveals a 145°F hotspot on the A-phase lug of a 500 MCM aluminum feeder, while the B and C phases sit at a normal 95°F. The load is measured at 360A.
The Diagnosis: Looking at the mcm wire size chart, a 500 MCM aluminum conductor (not listed above, but rated 310A at 75°C) is being pushed near its absolute thermal limit. However, the primary culprit in large MCM terminations is rarely just the ampacity; it is mechanical failure. Aluminum is highly susceptible to 'cold flow' (creep), where the metal slowly deforms under the constant pressure of the lug screw, leading to a loss of torque over time. Furthermore, aluminum rapidly forms a high-resistance oxide layer when exposed to air.
Step-by-Step Thermal Resolution
- Verify Torque Specifications: Do not rely on 'feel.' Use a calibrated torque wrench set to the exact inch-pound specification listed on the lug manufacturer's data sheet. For a 500 MCM lug, this often exceeds 400 in-lbs.
- Inspect for Belleville Washers: NEC and manufacturer guidelines require spring-loaded Belleville washers for aluminum terminations to compensate for cold flow and thermal expansion cycles. If missing, the connection will inevitably loosen.
- Oxide Inhibitor Application: The conductor strands must be wire-brushed and immediately coated with an antioxidant compound (e.g., Noalox or Penetrox) before insertion into the lug to prevent micro-arcing and resistive heating.
Troubleshooting Scenario 2: Parallel Feeder Current Imbalance
The Symptom: A 1600A service entrance utilizes four parallel sets of 500 MCM copper conductors per phase. The main breaker trips intermittently during peak summer loads, yet the total measured load never exceeds 1550A. Upon clamping individual parallel runs, you find Phase A currents of 450A, 420A, 380A, and 300A.
The Diagnosis: According to the mcm wire size chart, a single 500 MCM Cu wire is rated for 380A at 75°C. The run carrying 450A is severely overloaded, causing localized heating that eventually trips the thermal-magnetic element of the main breaker. NEC Article 310.10(H) mandates that parallel conductors must be identical in length, material, cross-sectional area, and routing to ensure equal impedance.
Identifying the Imbalance Root Cause
- Length Discrepancies: Even a 5% difference in cable length between parallel runs will cause a disproportionate current shift. Measure the exact physical length of each 500 MCM run. If the 300A run is 120 feet long and the 450A run is 105 feet, the shorter run is taking the path of least resistance.
- Magnetic Grouping and Proximity Effect: If the parallel sets are routed in separate conduits but grouped too closely together, or if the phase conductors are not arranged in a trefoil or symmetrical geometric pattern, the magnetic fields will induce unequal reactances. This is especially problematic in large MCM sizes where inductive reactance begins to rival DC resistance.
- Termination Resistance: A single loose crimp on one of the 500 MCM sets will bottleneck the entire parallel arrangement, forcing the remaining sets to overcompensate and overheat.
Troubleshooting Scenario 3: Severe Voltage Drop at Peak Load
The Symptom: A large HVAC chiller located 450 feet from the main switchboard fails to start under heavy grid load, and the contactor chatters. The nameplate demands 460V, but measurements at the starter show a sag to 415V during inrush.
The Diagnosis: Voltage drop in large feeders is frequently miscalculated because engineers use the standard DC resistance found in a basic mcm wire size chart without accounting for AC reactance and power factor. Let's assume the feeder is sized at 750 MCM Cu.
Calculating Drop with MCM Resistance Data
Using the DC resistance from our chart (0.0178 Ω/kft @ 75°C), the basic single-phase equivalent drop formula is:
VD = 2 × I × R × L
VD = 2 × 450A × (0.0178 / 1000) × 450 ft = 7.2 Volts.
A 7.2V drop on a 480V system is only 1.5%, which seems perfectly acceptable. So why is the chiller seeing a 45V drop? The answer lies in AC Impedance (Z) and the Skin Effect. For a 750 MCM conductor in steel conduit, the AC reactance (XL) adds significantly to the total impedance, especially during motor inrush when the power factor drops to 0.2 or lower. The effective AC impedance for 750 MCM in magnetic conduit can be nearly 30% higher than the DC resistance value listed in standard charts.
The Fix: To troubleshoot and resolve this, you must consult NEC Chapter 9, Table 9 for AC impedance values rather than relying solely on the DC resistance column of an mcm wire size chart. Upgrading the feeder to 1000 MCM, or paralleling two sets of 350 MCM (which reduces the skin effect due to the smaller individual conductor diameters), will lower the AC impedance and stabilize the inrush voltage.
Tools of the Trade for MCM Conductor Diagnostics
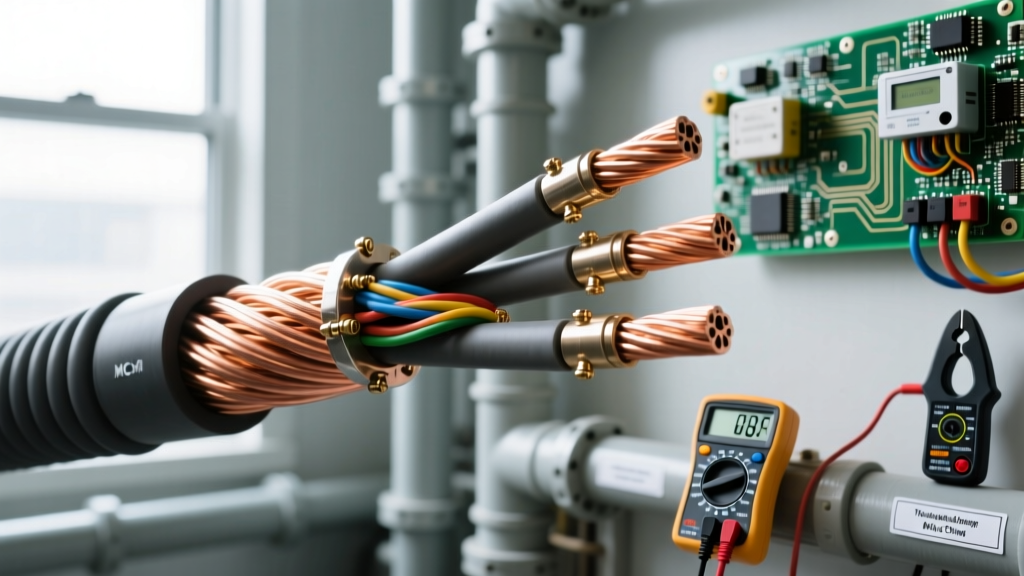
You cannot troubleshoot 500+ MCM conductors with standard handheld multimeters. The physical mass and electromagnetic properties of these cables require specialized diagnostic equipment:
- Flexible Coil Clamp Meters (e.g., Fluke iFlex): Standard clamp meter jaws simply cannot fit around a 1000 MCM conductor with its thick insulation. Flexible Rogowski coils are mandatory for measuring individual parallel feeder currents.
- Micro-Ohmmeters (Ductors): To verify termination integrity without relying solely on thermal imaging, a micro-ohmmeter injects a high DC current (e.g., 100A) and measures the micro-ohm resistance across the lug-to-busbar joint. A good 500 MCM termination should read in the low single-digit micro-ohms.
- High-Resolution Thermal Cameras: As noted by Fluke Corporation's thermal imaging guidelines, detecting a 10°C delta between phases on a large MCM lug is the earliest indicator of oxide buildup or torque loss, long before the insulation begins to melt or emit a burning odor.
Final Thoughts on High-Ampacity Troubleshooting
An mcm wire size chart is the starting point, not the finish line, for large-scale electrical troubleshooting. While the chart provides the fundamental geometry and baseline DC resistance, the real-world behavior of 250 to 1000 MCM cables is governed by thermal dynamics, AC reactance, and mechanical termination integrity. By combining the baseline data from your charts with advanced diagnostic tools and a strict adherence to NEC installation standards, you can accurately pinpoint the root causes of high-amperage failures and engineer robust, long-lasting corrections.