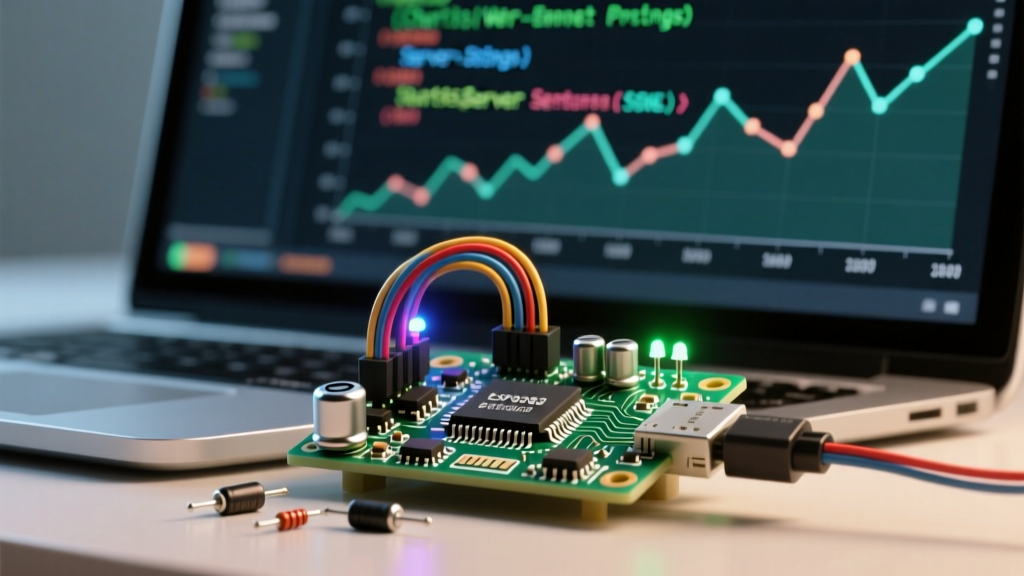

The Anatomy of an ESP8266 Web Server Graph
Creating a dynamic dashboard on a microcontroller is fundamentally a networking and memory management challenge. When you set out to build an ESP8266 web server graph, you are not merely writing HTML; you are orchestrating a continuous data pipeline between a constrained SRAM environment and a modern browser's rendering engine. The ESP8266, with its 80KB of usable SRAM and single-core 80MHz processor, cannot handle brute-force DOM manipulation or heavy synchronous HTTP polling without triggering the hardware watchdog.
Protocol Showdown: Delivering Real-Time Sensor Data
To plot live sensor data—such as temperature from a BME280 or current from an INA219—the browser needs a steady stream of numbers. The protocol you choose dictates the stability of your server. Below is a comparison of data delivery methods for microcontroller web servers.
| Protocol | Direction | Overhead | ESP8266 Suitability |
|---|---|---|---|
| AJAX Polling | Client to Server | High (HTTP headers per request) | Poor (Causes heap fragmentation) |
| WebSockets | Bidirectional | Low (After handshake) | Good (Complex for simple telemetry) |
| Server-Sent Events (SSE) | Server to Client | Very Low | Excellent (Ideal for live graphing) |
Why Server-Sent Events (SSE) Wins for Graphing
SSE allows the ESP8266 to push data to the browser over a single, long-lived HTTP connection. Unlike WebSockets, SSE operates over standard HTTP, meaning it passes through corporate proxies and firewalls without issue. Using the ESPAsyncWebServer library, we can implement an AsyncEventSource that pushes JSON-formatted telemetry the millisecond a sensor reading completes, without blocking the main loop.
Overcoming the ESP8266 SRAM Bottleneck
The most common failure mode for DIY dashboards is the Out-Of-Memory (OOM) crash. A standard Chart.js implementation requires loading the library, the CSS, and the HTML structure. If you attempt to serve a 60KB HTML string directly from a C++ raw string literal, the ESP8266 will fail to allocate the contiguous heap block required, resulting in a silent reboot.
The LittleFS and CDN Strategy
Never embed your JavaScript libraries directly into your sketch. Instead, store your lightweight index.html in the ESP8266's flash memory using LittleFS. In your HTML file, reference Chart.js via a Content Delivery Network (CDN). This offloads the heavy lifting to the client browser and keeps the ESP8266's heap strictly reserved for network buffers and sensor logic.
Structuring the JSON Payload for Chart.js
Chart.js expects specific data structures to update dynamically. Sending raw comma-separated values (CSV) forces the browser to run string-splitting operations. Instead, serialize your data into a lightweight JSON object. Avoid using the Arduino String class for JSON concatenation, as it causes severe heap fragmentation. Use a library like ArduinoJson or carefully formatted char arrays.
Always format your SSE payload as a lightweight JSON object containing only the delta or the latest data point, rather than the entire historical array. Let the browser manage the graph's historical buffer.
Implementing the Backend: AsyncEventSource
On the ESP8266, your setup routine must initialize the event source and attach it to the asynchronous server. You will map the /events endpoint to the AsyncEventSource object. Inside your main loop or a non-blocking timer callback, you read the sensor and dispatch the event:
events.send(String("{\"temp\":24.5,\"hum\":45}").c_str(), "sensor_data", millis());
Note that we pass a timestamp and a specific event name ("sensor_data"). This allows the frontend to listen exclusively to telemetry events, ignoring generic connection heartbeats.
The Frontend: JavaScript EventSource Integration
On the client side, the native JavaScript EventSource API listens to the endpoint. When a message arrives, it is parsed and pushed to the Chart.js dataset. Crucially, you must implement a First-In-First-Out (FIFO) shift operation. If you push a new data point every second without removing the oldest, the browser's memory will exhaust after a few hours, crashing the rendering tab.
Managing the Browser-Side FIFO Buffer
In your JavaScript frontend, managing the data window is critical. Chart.js does not automatically limit the number of data points. You must manually enforce a sliding window. When a new SSE payload arrives, parse the JSON, push the new value to chart.data.datasets[0].data, and simultaneously push a new timestamp to chart.data.labels. Immediately after, check the array length. If it exceeds your desired window (e.g., 60 seconds), use the shift() method to remove the oldest label and data point. Finally, call chart.update('none') to render the frame without triggering expensive CSS animations, which can cause frame drops on mobile devices.
Handling Sensor Latency and I2C Bus Lockups
When graphing data from I2C sensors like the BME280 or SHT31, a common issue is bus lockup due to electrical noise or loose wiring. If the ESP8266 halts waiting for an I2C clock stretch, it will fail to service the TCP stack, dropping the SSE connection. To prevent this, always use non-blocking sensor libraries or implement a hardware I2C reset routine using the Wire.setClock() and pin-toggle fallback methods before pushing data to the web server graph.
Troubleshooting Common Graph Rendering Failures
1. Watchdog Resets and TCP PCB Limits
The ESP8266's LWIP stack has a hard limit on concurrent TCP connections (usually around 5 to 8). If you open multiple browser tabs to view your ESP8266 web server graph, the device will run out of Protocol Control Blocks (PCBs). Subsequent connections will hang, and the watchdog timer (WDT) will reset the chip. Always implement a client-side heartbeat and limit simultaneous dashboard viewers.
2. CORS Errors on Local Networks
If your HTML is served from the ESP8266 but attempts to fetch resources from a different local IP or port, the browser will block it under Cross-Origin Resource Sharing (CORS) rules. Ensure your AsyncWebServer includes the Access-Control-Allow-Origin: * header in its responses to prevent silent data-fetching failures.
3. Chart.js Axis Scaling Jitter
When feeding real-time data, the Y-axis may constantly rescale, causing visual jitter. Lock the Y-axis minimum and maximum values in the Chart.js configuration options based on your sensor's physical limits (e.g., 0-100% for humidity) to maintain a stable, professional-looking dashboard.
Securing the ESP8266 Telemetry Pipeline
While an ESP8266 web server graph is often used on isolated local networks, exposing it to the internet requires caution. Standard HTTP SSE transmits data in plaintext. If your graph displays sensitive environmental data or controls relays alongside the telemetry, consider upgrading to an ESP32 for native TLS/SSL support. The ESP8266 can technically handle HTTPS via BearSSL, but the cryptographic handshake consumes nearly 30KB of RAM, leaving insufficient memory for stable graph rendering and concurrent connections. For the ESP8266, rely on WPA2-Enterprise Wi-Fi isolation or a reverse proxy (like Nginx) on a Raspberry Pi to handle SSL termination before the traffic reaches the microcontroller.
Network Topology: mDNS and Local Discovery
For a seamless user experience, hardcoding IP addresses is a fragile approach. DHCP servers frequently reassign local IP addresses, breaking your dashboard bookmarks. Integrate the ESP8266mDNS library to assign a static hostname to your device. By initializing MDNS.begin("sensor-graph"), users can access the dashboard via http://sensor-graph.local. Furthermore, you can broadcast the HTTP service via mDNS, allowing network scanning tools to automatically detect the ESP8266 web server graph and its active SSE endpoints without manual port scanning.