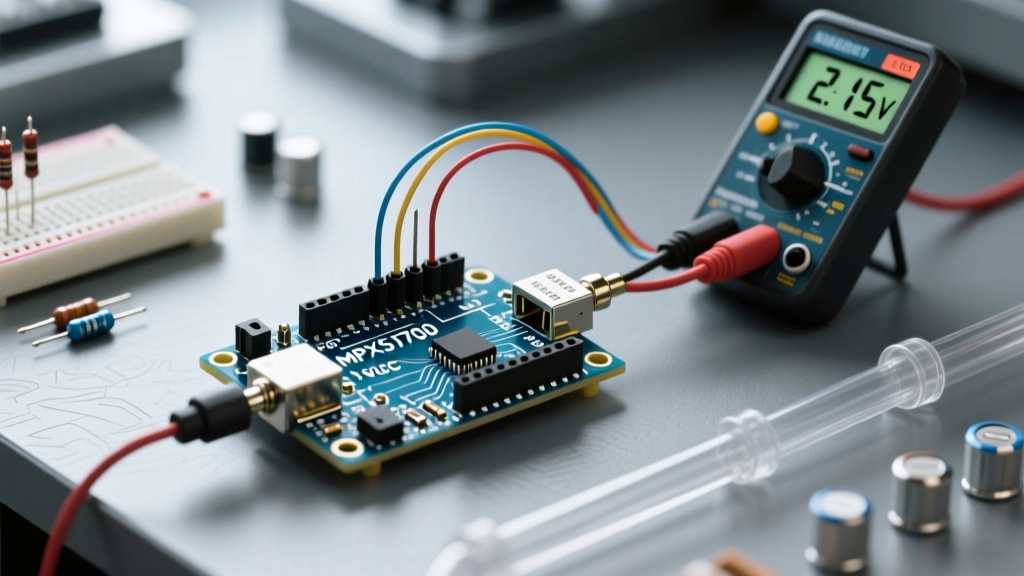

Why Factory Calibration Isn't Enough for Microcontrollers
When integrating an arduino water pressure sensor into a DIY hydroponic system, reverse osmosis monitor, or municipal water logging project, most makers plug a generic G1/4" transducer into analog pin A0, run a basic analogRead() script, and accept the results. However, they are often frustrated by fluctuations of ±10 to 15 PSI and significant zero-offset errors. The problem rarely lies in the sensing element itself; it lies in the uncalibrated, noisy signal chain of the microcontroller.
Factory calibration ensures the silicon piezoresistive die inside the sensor housing responds linearly to applied force. It does not account for the voltage droop of your Arduino's USB power rail, the quantization error of a 10-bit internal ADC, or the specific offset drift introduced by your unique wiring harness. According to the National Institute of Standards and Technology (NIST), achieving metrological traceability in pressure measurement requires calibrating the entire signal chain—from the physical diaphragm to the final digital output—as a single unified system.
In this 2026 guide, we will bypass generic tutorials and dive into a rigorous, lab-grade wet calibration methodology for Arduino-based pressure sensing, ensuring your readings are accurate to within ±0.5 PSI.
The Signal Chain Bottleneck: Internal ADC vs. External Precision
Before calibrating, you must understand the resolution limits of your hardware. The most common Arduino water pressure sensor on the market is the generic stainless steel G1/4" 0-1.2MPa (0-174 PSI) transducer, which costs around $9 in 2026. It features a ratiometric output ranging from 0.5V (at 0 PSI) to 4.5V (at 174 PSI).
If you use the internal 10-bit ADC of an ATmega328P (Arduino Uno/Nano) referenced to a noisy 5V USB rail, your resolution is roughly 4.88mV per step. Across the 4.0V sensor span, that equates to a theoretical best-case resolution of 0.42 PSI per step. In reality, USB rail noise introduces ±3 LSBs of jitter, degrading your practical accuracy to nearly ±1.5 PSI before thermal drift is even considered.
Hardware Upgrade Matrix for High Accuracy
To achieve lab-grade accuracy, you must upgrade the Analog-to-Digital Converter (ADC) and stabilize the voltage reference. Below is a comparison of common setups used in precision fluid monitoring:
| Hardware Configuration | Resolution (PSI) | Noise Immunity | Est. Cost (2026) | Best Use Case |
|---|---|---|---|---|
| Arduino Internal 10-bit ADC (5V Ref) | ~0.42 PSI (Theoretical) | Poor (USB noise coupled) | $0 (Built-in) | Rough leak detection |
| Arduino Internal ADC + LM4040 4.096V Shunt Ref | ~0.34 PSI | Moderate | $1.50 | Budget precision logging |
| ADS1115 16-bit External ADC + 4.096V Ref | ~0.0026 PSI | Excellent (I2C digital transfer) | $4.50 | Lab-grade calibration & dosing |
| Digital Sensor (e.g., Honeywell ABP2 I2C) | ~0.005 PSI | Superior (On-chip DSP) | $14.00 | Medical/Industrial replacement |
For the calibration procedure below, we assume you are using an ADS1115 16-bit ADC module paired with an LM4040 4.096V precision voltage reference. This combination provides 32,768 discrete steps across your sensor's output range, effectively eliminating quantization error as a variable.
The 3-Point Wet Calibration Method
Dry calibration (using an air compressor) is risky for liquid-rated sensors due to compressibility hazards and the lack of damping that water naturally provides. A wet calibration rig ensures the diaphragm is loaded exactly as it will be in deployment.
Step 1: Build the Hydrostatic Test Rig
You need a closed-loop test manifold. Assemble the following components:
- Master Gauge: A NIST-traceable digital pressure gauge (e.g., Ashcroft or Fluke) with at least 0.1% full-scale accuracy.
- Manifold Block: A brass or stainless steel cross-fitting (G1/4" threads).
- Fluid Source: A large 60mL syringe filled with distilled water, connected via a Luer-lock to G1/4" adapter.
- Bleed Valve: A miniature ball valve to purge trapped air bubbles. Air bubbles will act as springs, causing severe hysteresis during calibration.
Screw your Arduino water pressure sensor into one port, the master gauge into the second, the syringe into the third, and the bleed valve into the fourth. Purge the system until only water remains.
Step 2: Capture the Zero-Offset (Atmospheric)
With the bleed valve open to the atmosphere, the physical pressure on the sensor is exactly 0 PSI (gauge). Read the raw digital value from your ADS1115. Take 50 samples, discard the top and bottom 10 outliers to remove transient spikes, and average the remaining 30. Record this as ADC_Zero. For a perfectly calibrated 0.5V offset on a 4.096V reference 16-bit ADC, this value should theoretically be around 4000, but manufacturing tolerances usually place it between 3850 and 4150.
Step 3: Apply Mid-Span and Full-Scale Pressures
Close the bleed valve. Slowly depress the syringe to raise the hydrostatic pressure. Watch the master gauge.
- Stop at exactly 50.0 PSI. Wait 10 seconds for the diaphragm to settle and thermal equilibrium to stabilize. Record the averaged ADC value as
ADC_Mid. - Continue depressing the syringe to exactly 100.0 PSI. Wait 10 seconds. Record the averaged ADC value as
ADC_Full.
Note: Never exceed 120% of the sensor's rated pressure (approx 208 PSI for a 174 PSI sensor) during calibration, as this will cause plastic deformation of the internal steel diaphragm, permanently ruining the linearity.
Step 4: Calculate the Transfer Function
Pressure sensors exhibit a linear response defined by the equation y = mx + b, where y is Pressure (PSI), x is the ADC reading, m is the slope (sensitivity), and b is the y-intercept (zero offset). Using the data gathered from your master gauge, calculate the slope:
Expert Insight: Do not rely solely on the factory datasheet's "0.008 * V_s" sensitivity multiplier. As noted in Arduino's official analog reference documentation, component tolerances in the signal conditioning op-amps on cheap breakout boards can shift the actual slope by up to 4%. Always derive m empirically using your mid-span and full-scale data points.
Slope (m): (100.0 - 50.0) / (ADC_Full - ADC_Mid)
Intercept (b): 50.0 - (m * ADC_Mid)
Hardcode these calculated m and b constants into your Arduino sketch. Your final pressure reading code will simply be: float pressure_psi = (raw_adc * m) + b;
Mitigating Real-World Signal Noise and Failure Modes
Even with perfect mathematical calibration, physical phenomena in fluid dynamics can destroy your accuracy. Address these edge cases in your system design:
1. Water Hammer and Cavitation
When a solenoid valve closes rapidly in a water line, the kinetic energy of the moving fluid creates a shockwave known as water hammer. This can spike local pressure to 5x the static line pressure for a few milliseconds. While your Arduino's sampling rate might miss the spike, the mechanical shock can cause micro-fractures in the sensor's piezoresistive Wheatstone bridge over time, leading to permanent zero-drift. Solution: Install a $5 brass hydraulic accumulator (expansion tank) or a simple snubber orifice upstream of the sensor to dampen hydraulic shock.
2. Thermal Zero-Shift
Silicon piezoresistive sensors are highly sensitive to temperature. If you calibrate your sensor at 20°C (68°F) in your workshop, but deploy it in a greenhouse where water temperatures reach 35°C (95°F), the zero-offset will drift. High-end sensors like the TE Connectivity MS5837 include an onboard thermistor for software compensation. If using a generic analog transducer, you must add a DS18B20 waterproof temperature probe to your manifold and apply a thermal compensation matrix in your code, subtracting roughly 0.15 PSI for every 10°C rise above calibration temperature.
3. Electromagnetic Interference (EMI)
Analog pressure sensors output low-voltage millivolt signals that act as antennas for EMI from nearby water pumps and relay coils. As detailed in Omega Engineering's calibration guidelines, signal conditioning requires physical separation and shielding. Always use twisted-pair shielded cable for analog sensors, grounding the shield at the microcontroller end only to prevent ground loops. Alternatively, use an I2C digital sensor to move the ADC conversion directly to the sensor head, rendering the signal immune to cable-induced noise.
Frequently Asked Questions
Can I calibrate a water pressure sensor using an air compressor instead of water?
While physically possible, it is highly discouraged. Air is highly compressible. If a fitting fails or the diaphragm ruptures under 100 PSI of air pressure, the rapid expansion of gas can shatter the sensor housing and cause severe injury. Water is virtually incompressible; a failure at 100 PSI results in a harmless leak rather than an explosion. Furthermore, air lacks the damping properties of water, which can cause the sensor's internal op-amp to oscillate during rapid pressure changes.
Why does my pressure reading slowly drop over 24 hours even though the system is sealed?
This is typically caused by creep or stress relaxation in the O-ring seals of your plumbing fittings, not the sensor itself. Standard PTFE tape can compress over time under constant hydrostatic load. For permanent, sealed calibration rigs, use liquid thread sealant (like Loctite 567) or bonded EDPM O-ring face seals (ORFS) instead of tapered NPT threads.
How often should I recalibrate my Arduino water pressure sensor?
For non-critical DIY applications (e.g., garden irrigation monitoring), a single initial calibration is sufficient for the lifespan of the sensor (typically 3-5 years). For critical dosing systems or commercial hydroponics, perform a 1-point zero-offset check every 6 months by venting the sensor to the atmosphere and verifying the reading returns to exactly 0.0 PSI. If the zero-offset has drifted by more than 1.5 PSI, the internal diaphragm has likely suffered plastic deformation from water hammer, and the sensor must be replaced.